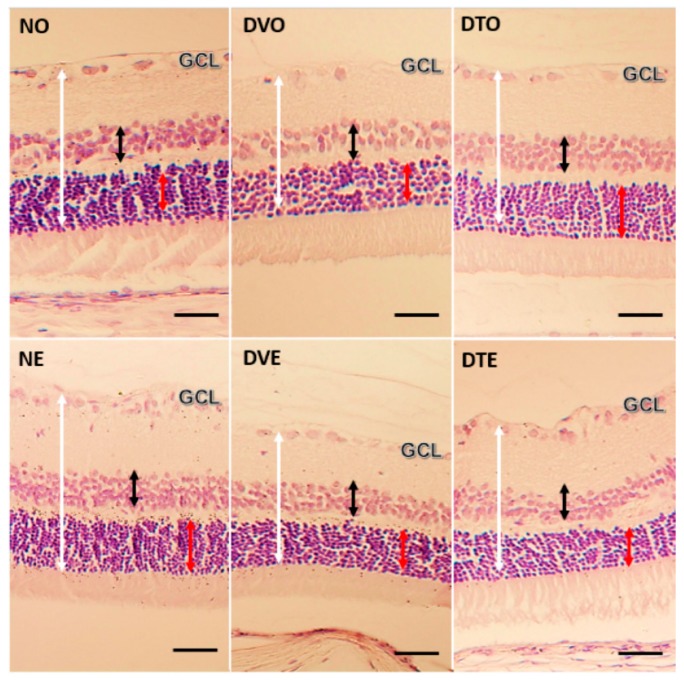
Figure 3.
Microphotograph of H&E stained retinal sections from various groups of animals, showing the effect of TRF on retinal layer thickness (magnification 20×). White arrow: Retinal thickness from the inner limiting membrane (ILM) to outer limiting membrane (OLM); Black arrow: Thickness of inner nuclear layer (INL); Red arrow: Thickness of outer nuclear layer (ONL); NO: Normal rats with oral vehicle treatment, DVO: Diabetic rats with oral vehicle treatment, DTO: Diabetic rats with oral TRF treatment. NE: Normal rats with topical vehicle treatment, DVE: Diabetic rats with topical vehicle treatment, DTE: Diabetic rats with topical TRF treatment. (Scale bar: 50 µm).

