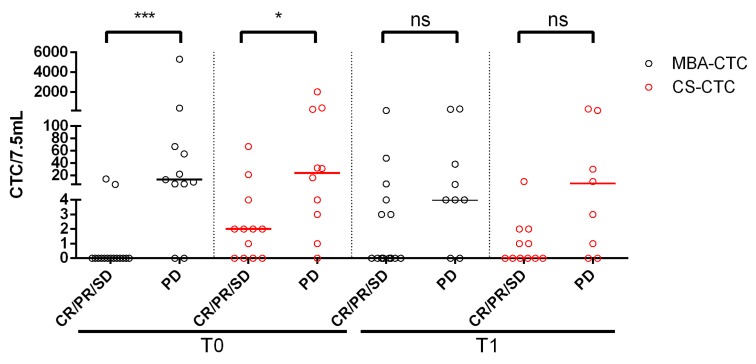
Figure 3.
Comparison between CTC levels as detected by the metabolic-based assay (MBA) and CellSearch (CS) and imaging. This plot shows the CTC count for individual patients at baseline (T0) and follow-up (T1), compared with their response at the first follow-up imaging. (CR/PR/SD = Complete Response/Partial Response/Stable Disease; PD = Progressive Disease. Statistical significance was calculated by Mann-Whitney test (*** p = 0.0001, * p = 0.027, ns = not significant (CS-CTCs: p = 0.05; MBA-CTCs: p = 0.07).

