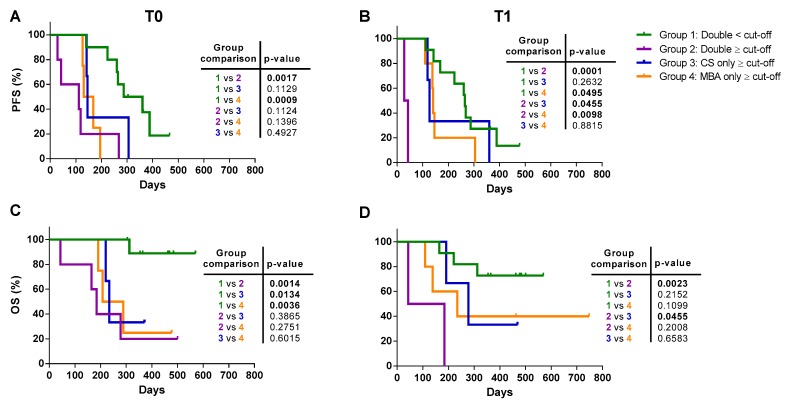
Figure 5.
Progression-free survival (PFS) and overall survival (OS) of mBC patients stratified by the combination of the metabolic-based assay (MBA) and CellSearch (CS) method. The patients were stratified into four group: group 1 (green curve), patients with a CTC count below the cut-off with both methods; group 2 (violet curve), patients with a CTC count ≥ cut-off with both methods; group 3 (blue curve), patients with a CTC count ≥ cut-off only for the CS; and group 4 (yellow curve), patients with CTC count ≥ cut-off only for the MBA. (A) PFS of mBC patients stratified by the combination of the two methods at baseline (T0) and (B) follow-up (T1). (C) OS of mBC patients stratified by the combination of the two methods at baseline (T0) and (D) follow-up (T1). Statistical analysis of PFS and OS between the four groups are reported in the embedded tables.

