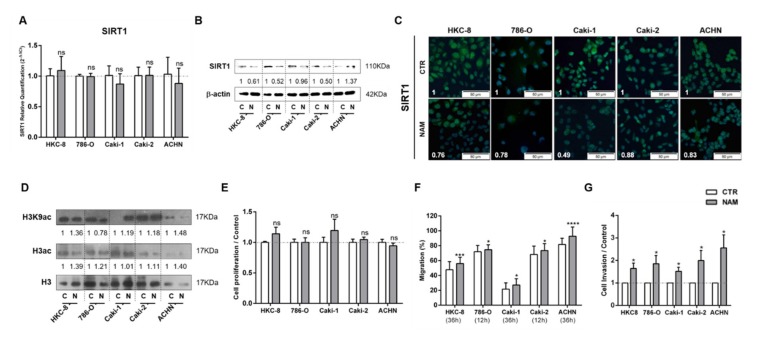
Figure 4.
Nicotinamide (NAM) mimicked lactate effect in kidney cell lines. Characterization of SIRT1 expression by RT-qPCR (A), Western blot (B), and immunofluorescence (C). Characterization of global histone acetylation of histone H3 and specific histone marker H3K9 (D) by Western blot. Effect at cell proliferation by BrdU assay (E), cell migration by wound-healing assay (F), and cell invasion by Matrigel invasion chambers (G). Western blot and immunofluorescence quantification are represented as fold change of 200 µM nicotinamide versus control condition; * p < 0.05, *** p < 0.001, **** p < 0.0001 and ns p > 0.05 (non-significant) Abbreviations: C/CTR—control, N/NAM—200 µM nicotinamide.

