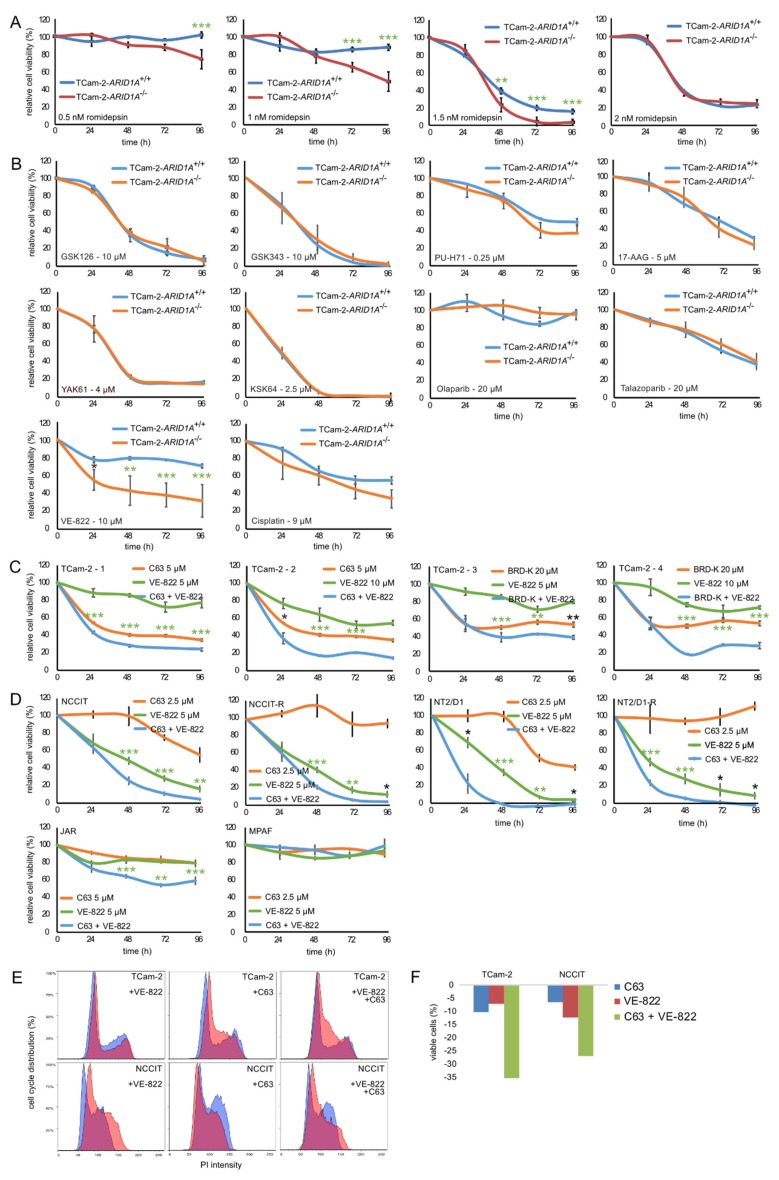
Figure 2.
(A) XTT data of TCam-2-ARID1A+/+ and -ARID1A−/− clones (average) treated once with 0.5–2 nM romidepsin. (B) XTT data of TCam-2-ARID1A+/+ and -ARID1A−/− clones (n = 4) treated once with EZHi GSK126 or GSK343 (both 10 μM), PARPi olaparib or talazoparib (both 20 μM), HSP90i PU-H71 (0.25 μM) or 17-AAG (5 μM), HDAC6i YAK61 (4 μM) or KSK64 (2.5 μM), cisplatin (9 μM) and ATRi VE-822 (10 μM). (C) XTT data of TCam-2-ARID1A+/+ cells treated with C63 (5 μM) or BRD-K (20 μM) alone or in combination with VE-822 (5 μM, 10 μM). (D) XTT data of NCCIT(-R), NT2/D1(-R) and JAR cells treated with C63 and/or VE-822. As control, MPAF fibroblasts were included. A–D) Changes in viability (compared to solvent treated controls) were measured over 96 h. p-values * < 0.05, ** < 0.005, *** < 0.0005; p-values labelled in green were still significant after correction for multiple testing. (E,F) PI- and Annexin V-based flow cytometry analysis of cell cycle phase distribution (E) and apoptosis rates (F) in TCam-2 and NCCIT cells treated with C63 and/or VE-822 for 24 h.

