Figure 1.
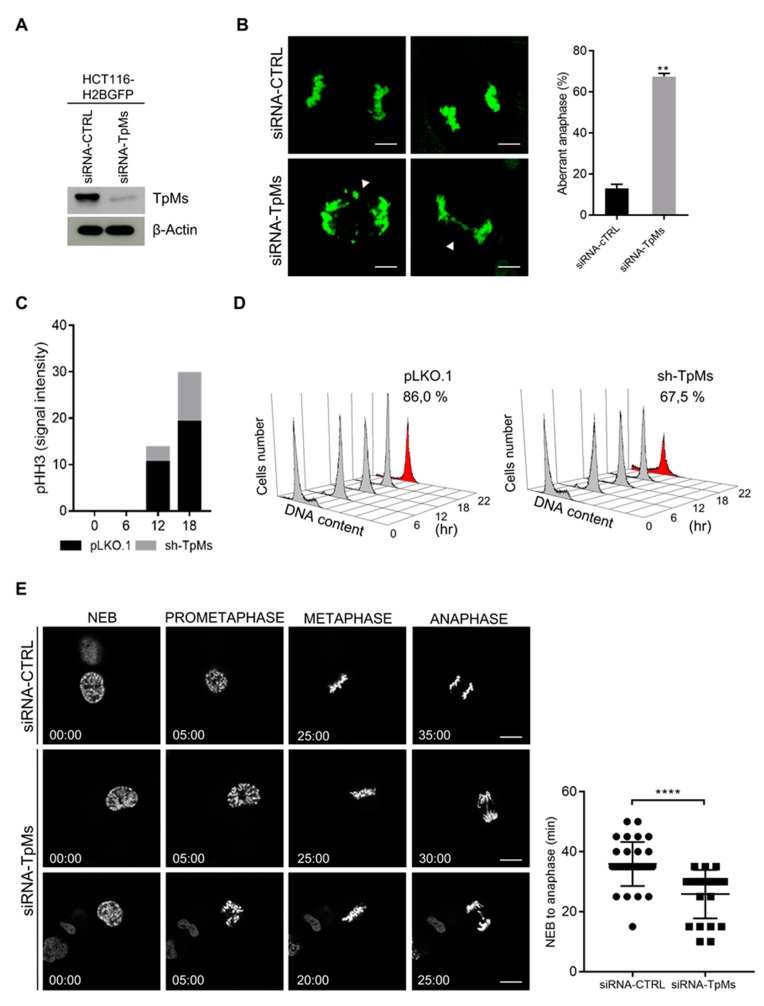
TpMs-depleted cells display chromosome segregation errors and defective spindle checkpoint. (A) Immunoblot showing decreased levels of TpMs after transient transfection with siRNA-CTRL and siRNA-TpMs in HCT116 cells stably expressing enhanced green fluorescent protein-labelled histone H2B. (B) Representative pictures of lagging chromosomes and chromosome bridges in anaphase (white arrowheads) (left panel, HCT116 cells) scale bars 10 µm. Quantification as percentage of aberrant anaphases (right panel) (p-value = 0.002). (C) Phosphorylation of histone H3 were assessed by immunoblotting and quantified by densitometry in TpMs-deficient HeLa cells. Cells were synchronized by aphidicolin treatment and released in nocodazole at different times. (D) Flow cytometry analysis of HeLa cells stably transfected with shRNA-TpMs vector or control vector (pLKO.1). Cells were released from a G1/S phase block (obtained by aphidicolin) into a nocodazole-containing medium and collected at the indicated times. (E) HCT116 were stably transfected with enhanced green fluorescent protein-labelled histone H2B and transiently transfected with siRNA-CTRL and siRNA-TpMs. The average time from nuclear envelope breakdown (NEB) to anaphase onset is measured by time-lapse microscopy. Each symbol in the scatter plot represents a single cell (right panel) (p-value < 0.0001). Representative fluorescence video-microscopy series of HCT116 cells (left panel). Scale bars 10 µm. Error bars represent s.d. (n = 3).

