Figure 3.
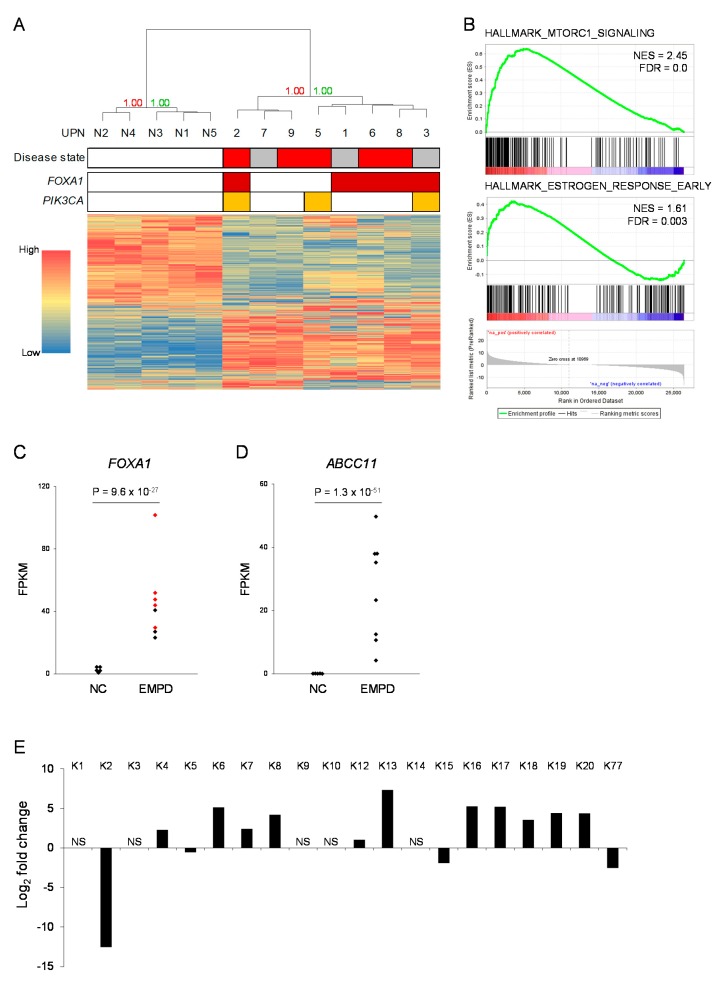
Global gene expression profiling of EMPD. (A) Hierarchical clustering using the global expression profiles obtained by RNA-seq. N1–N5 indicate normal skin samples obtained from healthy volunteers. On the disease state line, red and gray boxes indicate invasive disease state and in situ disease state, respectively. Red and green numbers indicate the bootstrap probability and the approximately unbiased p-value, respectively. (B) Gene set enrichment analysis using the hallmark gene set database. Genes associated with mTOR signaling (HALLMARK_MTORC1_SIGNALING) and estrogen response (HALLMARK_ESTROGEN_RESPONS_EARLY) are relatively upregulated in EMPD samples. NES, normalized enrichment score; FDR, false discovery rate. (C,D) Expression levels (fragments per kilobase per million; FPKM) of FOXA1 (C) and ABCC11 (D). Red dots in (C) indicate samples associated with FOXA1 aberrations, NC, normal controls. (E) Differential expression of keratin family genes between EMPD and normal skin samples. Positive values indicate genes upregulated in EMPD samples. NS, not significantly different (adjusted p-value >0.1).

