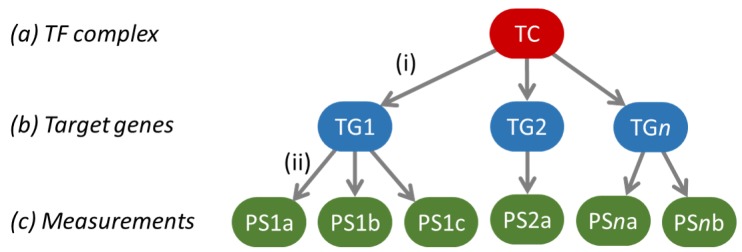
Figure 1.
The general structure of the Bayesian network models used to model a pathway’s transcriptional program. The green ovals indicate the probesets on the Affymetrix arrays used to measure target gene levels, and the respective target genes are indicated in the blue ovals as TG 1 to n. After calibration, the model is used to infer backwards from the target gene levels what the odds are that the pathway-associated transcription factor complex (TC) is active or not, as a quantitative readout for signaling pathway activity.

