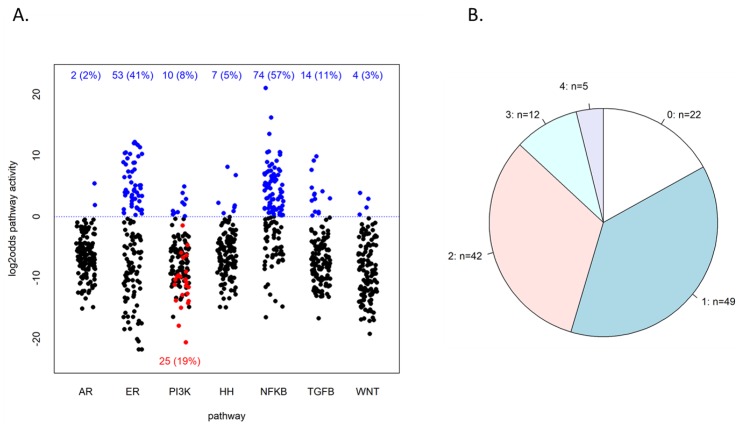
Figure 2.
Resulting pathway activities of the study cohort. (A) Resulting log2odds values of pathway analysis on the 130 patient samples. The dotted blue line indicates the default threshold of 0 on the log2odds scale, and the numbers in blue at the top indicate the number of samples above this threshold. PI3K pathway log2odds score is taken as the inverse of the FOXO score, so samples below the line had a high FOXO score. Among the latter are 25 samples that also had an elevated SOD2 expression, indicated in red. PI3K active samples can be counted as those that had either low FOXO activity or FOXO-high-SOD2-high (explained in the text and [4]). (B) Frequencies of the number of different pathways with high activity within the same sample; n = the number of samples that have 0, 1, …, 4 pathways high, as indicated.

