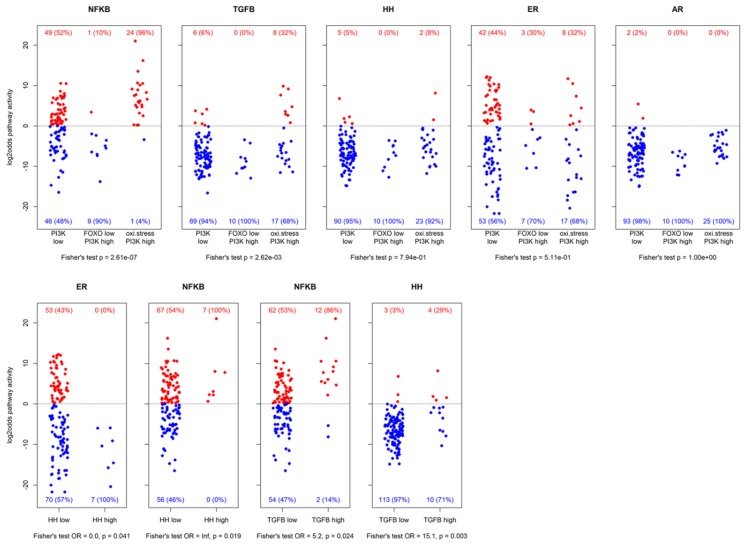
Figure 3.
Resulting log2odds scores of pathway analysis across different groups of samples. The top row shows activity for PI3K pathway inactive, FOXO-low PI3K pathway active, and oxidative stress PI3K pathway active samples. The bottom row shows activity of some pathways vs. HH pathway activity and TGFβ pathway activity. Patient numbers are indicated with corresponding percentages (between brackets). Reported p-values are nominal.

