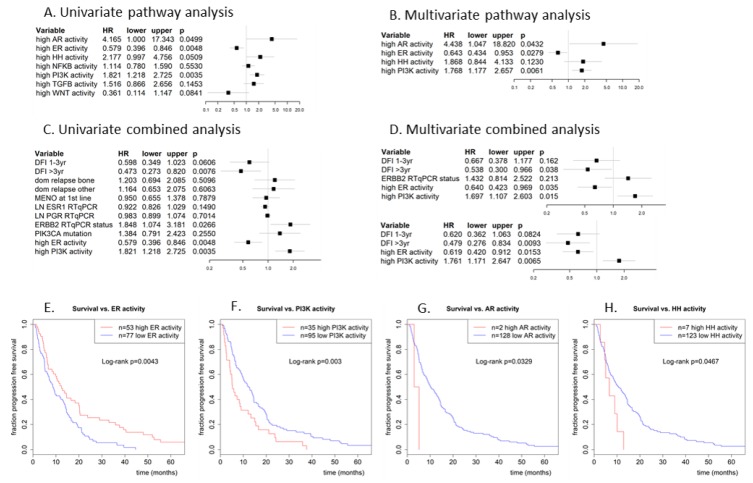
Figure 4.
Cox proportional hazards regression analysis of progression-free survival vs. (A,B) dichotomized pathway activities (log2odds > 0) and vs. (C,D) dichotomized pathway activities combined with traditional predictors. (A) univariate analysis with all 7 pathways, (B) multivariate analysis of pathway activities that were significant in the univariate analysis, (C) univariate analysis of most significant pathways from (B) with clinical predictors, (D) multivariate analysis with the significant predictors from univariate analysis (D). Used clinical predictors are: disease-free interval (1–3yr or >3yr vs. reference DFI < 1yr), dominant site of relapse (bone or other vs. reference local), menopausal status at start 1st line therapy, log ESR1 and PGR RT-qPCR expression (as continuous predictor), HER2/ERBB2 RT-qPCR status (amplified vs. reference not amplified) and PIK3CA mutation status (mutated vs. reference wildype). (E) Kaplan-Meijer plot for progression-free survival of patients with a high ER pathway activity (log2odds > 0; red line) vs. patients with a low ER pathway activity (log2odds ≤ 0; blue line). (F) Similarly, for the PI3K pathway, (G) AR pathway, and (H) HH pathway. The PI3K pathway is considered to be active in case of low FOXO activity or in case of combined high FOXO activity and elevated SOD2 expression.

