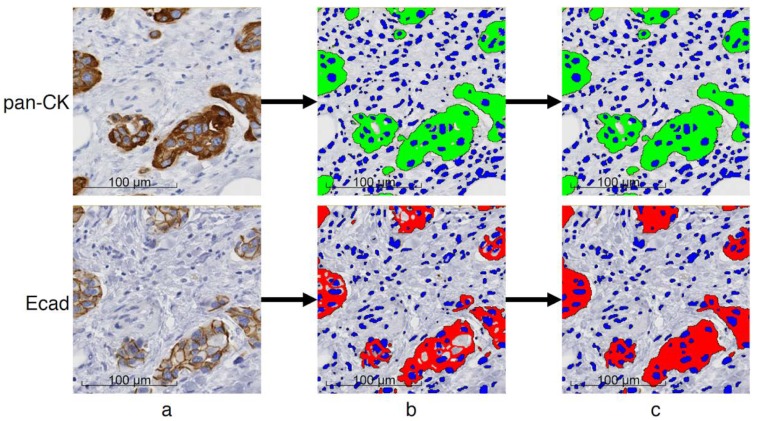
Figure A1.
Image processing to quantify cells expressing pan-CK and E-cad on two consecutive slides. (a) Input images shown at 20× magnification (0.453 µm-side pixel), (b) intermediary result after the thresholding step identifying DAB staining and cell nuclei, and (c) final result after both thresholding and post-processing to identify whole cell areas except the nuclei.

