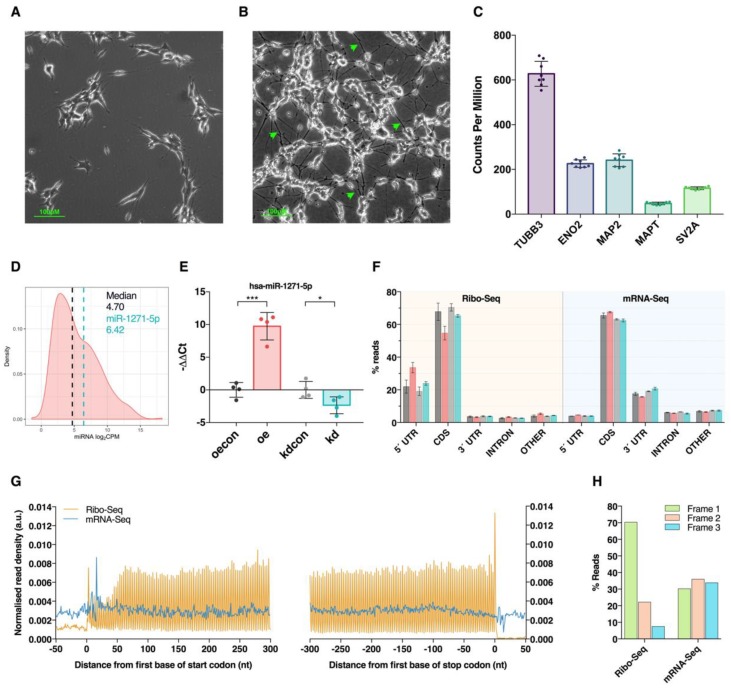
Figure 1.
Ribosome profiling of SH-SY5Y cells after miR-1271-5p differential expression. (A,B) Phase contrast images of SH-SY5Y cells prior to (A) and after (B) treatment with retinoic acid for 5 days. Note the development of neurites (green arrowheads) after differentiation. (C) Expression of known neuronal marker genes in all control cells, as detected via mRNA sequencing. Data are presented as counts per million (CPM) ± SD. (D) Distribution of log2 counts per million (CPM) values for mature miRNAs expressed in differentiated SH-SY5Y cells, as detected previously by small RNA sequencing. The vertical black line represents median CPM. The vertical blue line represents miR-1271-5p CPM. (E) qPCR validation of miR-1271-5p overexpression (red) and knockdown (blue) after lipofection with miR-1271-5p mimic or antisense inhibitor constructs, respectively. Mimic-transfected cells were compared via a negative control scrambled siRNA (black), whereas sponge-transfected cells were compared to a negative control inhibitor construct (grey). Ct values were normalised to U6 and U44 housekeeping small RNAs with the geometric mean of both used as a reference. Differential expression was calculated via Student’s t-test with significant differential regulation of miR-1271-5p observed in both mimic-transfected cells (log2fc = 9.04, p < 0.001) and inhibitor-transfected cells (log2fc = −2.18, p < 0.05). Data presented as mean −ΔΔCt ± SD. * = p < 0.05, *** = p < 0.001. (F) Genomic feature alignment rates for Ribo-Seq and mRNA-Seq libraries. Colour coding is the same as in Panel (E). (G) Metagene analysis of normalised read density around translation start (left) and stop (right) codons. Composite data are shown for Ribo-Seq and mRNA-Seq libraries, with ribosome-protected RNA fragments (RPFs) calibrated to predicted ribosome P sites. (H) Sub-codon phasing of sequencing data to each potential transcript coding sequence (CDS) reading frame revealed Ribo-Seq data that exhibits preference for the first, canonical reading frame, while mRNA-Seq data shows a relatively even spread across all three frames due to random fragmentation.

