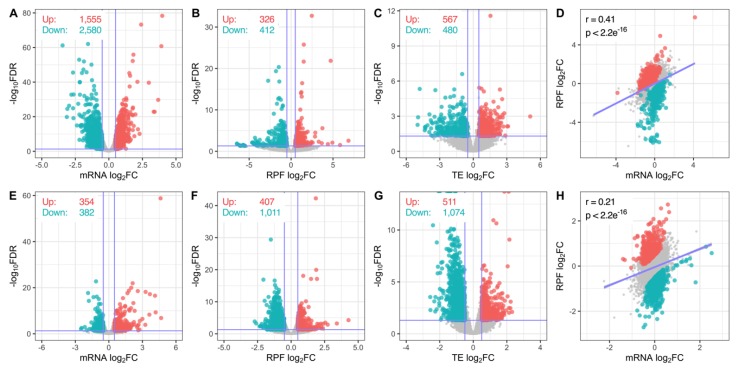
Figure 2.
Differential expression analysis and functional annotation. (A–C) Volcano plots comparing gene log2 fold-change and –log10 false discovery rate (FDR, Benjamini-Hochberg) at the mRNA (A), RPF (B), and TE (C) levels after miR-1271-5p overexpression. Horizontal line represents FDR = 0.05. Significantly upregulated and downregulated genes (FDR < 0.05, log2fc > | ± 0.5|) are marked in red and blue, respectively. (D) Comparison of gene mRNA and RPF log2 fold-change expression values. Pearson’s correlation coefficients and associated p-values reported top left. Coloured genes were subjected to significant changes in TE. (E–H) As in (A–D), except after miR-1271-5p knockdown.

