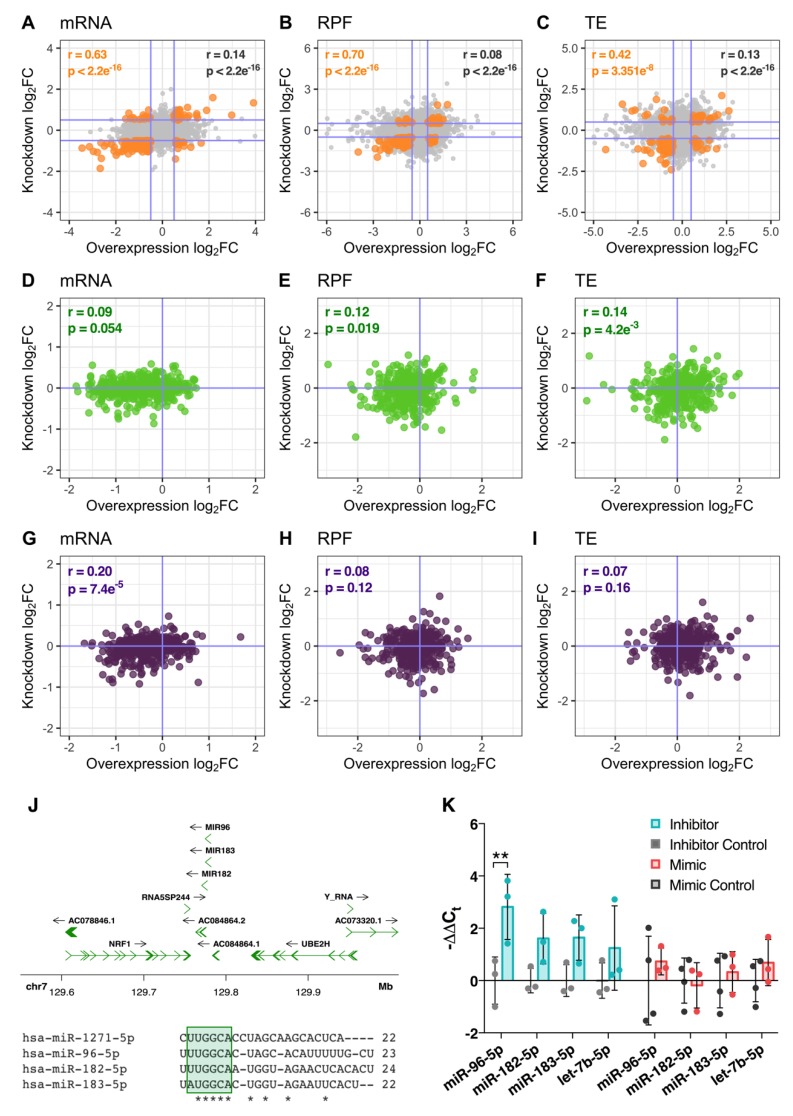
Figure 6.
Comparison of gene expression profiles between experiments and analysis of miRNAs with a similar seed sequence. (A–C) Scatter plots comparing mRNA (A), RPF (B), and TE (C) log2 fold changes between overexpression and knockdown conditions. Genes significantly regulated in both conditions are marked in orange. All other genes are coloured grey. (D–I) As in (A–C), except examining the expression of genes with only 3′UTR (D–F) or CDS (G–I) miR-1271-5p binding sites. (J) Genomic context of the miR-96/183/182 polycistronic miRNA cluster and multiple sequence alignment versus miR-1271-5p. Note the similar seed regions, shaded in green. Asterisks denote bases conserved amongst all 4 miRNAs. (K) qPCR analysis of miR-96-5p, miR-182-5p, and miR-183-5p expression levels after miR-1271-5p knockdown and overexpression. let-7b-5p was also included to ensure any changes in the miR-196/183/182 cluster were not due to global rises in miRNA processing. Data presented as mean −ΔΔCt ± SD. Expression was compared to control cells via Student’s t-test with post-hoc correction for multiple testing using Benjamini, Krieger, and the Yekutieli method. FDR < 0.05 was considered significant (** = FDR < 0.01).

