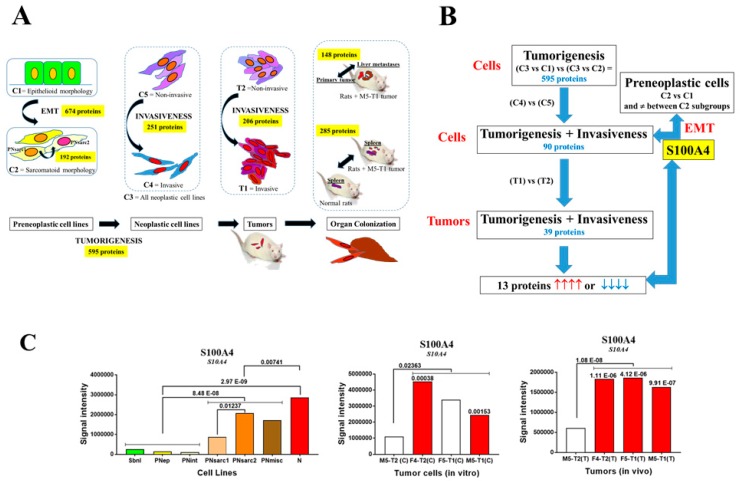
Figure 1.
Identification of S100A4 as the main biomarker. (A) Scheme of the successive steps and sources of data used for the identification of candidate biomarkers. C1, preneoplastic cell lines with epithelioid morphology. C2, preneoplastic cell lines with sarcomatoid morphology. C3, neoplastic cell lines. C4, invasive neoplastic cell lines. C5, non-invasive neoplastic cell line. T1, invasive MM (malignant mesothelioma) tumors. T2, non-invasive MM tumor. (B) Methodology used for SWATH-MS (sequential window acquisition of all theoretical fragmentation spectra) proteomic analyses of cell lines and tumors. (C) Comparative proteomic abundances of S100A4 (significant increases in red and decreases in blue, with p values). Left: comparison between the different subgroups and groups of preneoplastic and neoplastic cell lines (in vitro); middle: comparison between invasive and non-invasive neoplastic cell lines (in vitro); right: comparison between invasive and non-invasive mesotheliomas (in vivo). Blank bars correspond to the absence of significant differences between cell lines/tumors.

