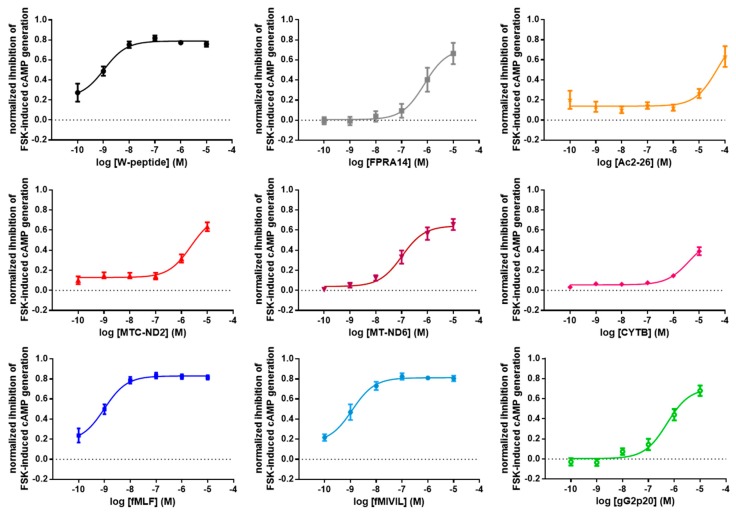
Figure 2.
Concentration–response curves for FPR1-mediated inhibition of cAMP production. Cells were stimulated with forskolin (FSK) and the respective FPR1 agonists. Responses recorded 30 min after agonist addition were normalized to the maximum system response obtained with forskolin. Data points represent the mean ± SEM of at least 7 independent measurements.

