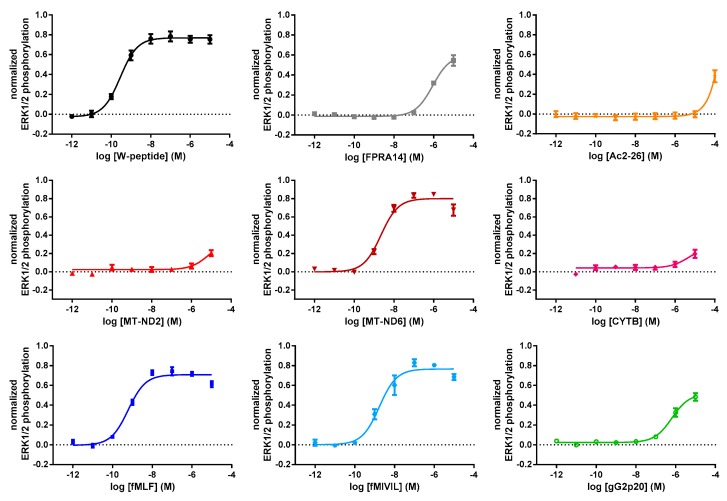
Figure 3.
Concentration–response curves for FPR1-mediated phosphorylation of ERK1/2 on Thr202/Tyr204. Responses monitored 5 min after the addition of agonist were normalized to the maximum system response, which was obtained with PMA (phorbol 12-myristate 13-acetate). Data points represent the mean ± SEM of at least 5 independent measurements.

