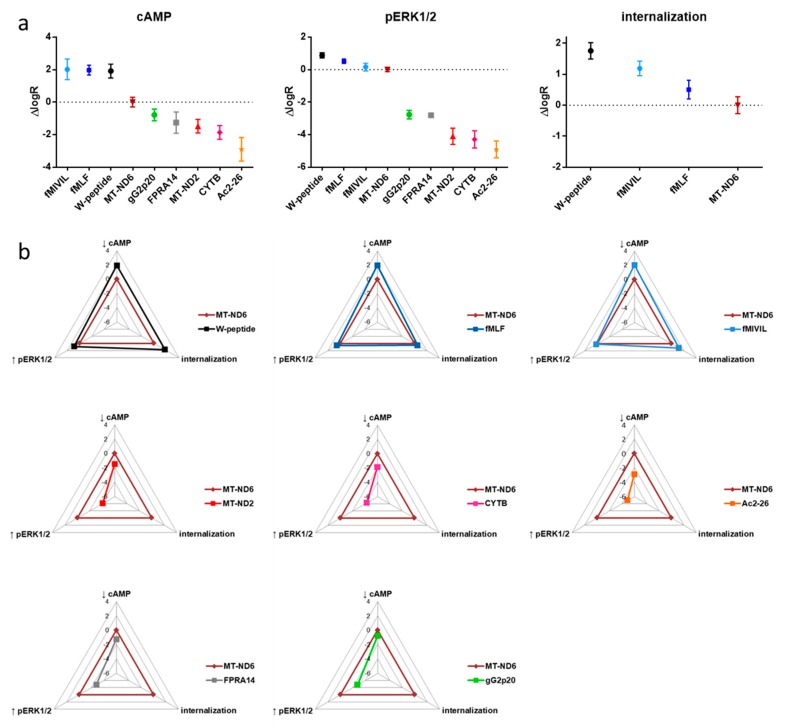
Figure 7.
Relative agonist profiles compared to the endogenous reference agonist. (a) ΔlogR values were calculated from logR values with the mitochondrial peptide MT-ND6 as reference agonist. Data points represent the mean and 95% confidence intervals. (b) Relative agonist activities corresponding to the ΔlogR values for the respective pathways are depicted in radial graphs. Each radius is displayed in the logarithmic scale.

