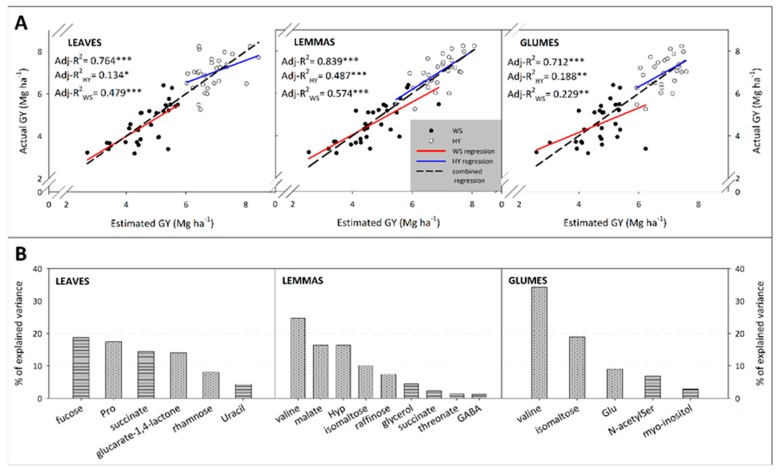
Figure 5.
Multiple regression models with the variables selected by 70% of model runs (A) and their respective relative importance analyses for the variables (B). Blue: fitted line for high-yielding (HY) conditions, red: fitted line for water stress (WS), dotted line: fitted line for WS and HY conditions combined. Below, doted bars indicate metabolites negatively affecting grain yield (GY) and horizontal pattern bars indicate metabolites positively affecting GY.

