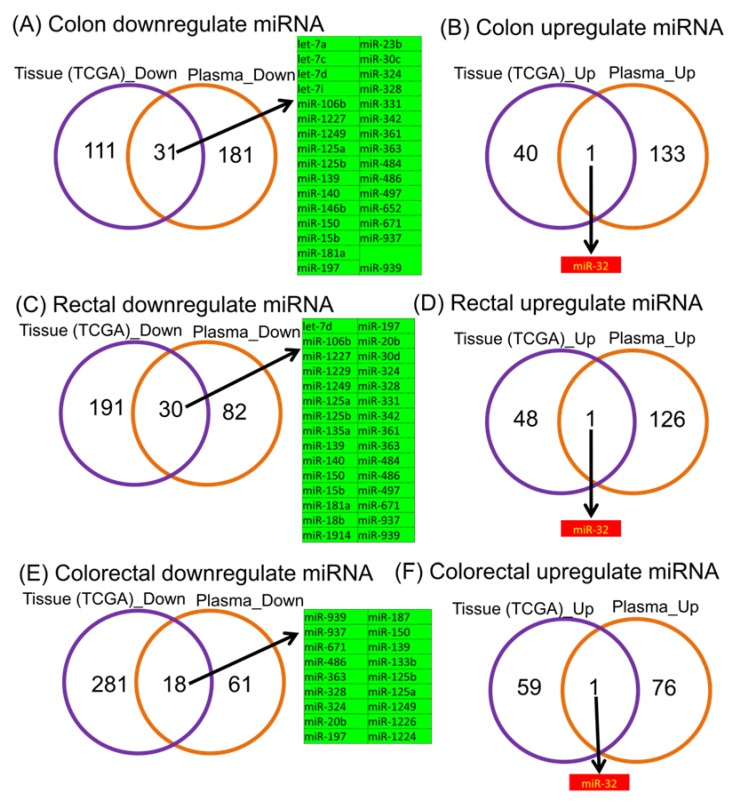
Figure 2.
Common miRNA expression profile pattern in TCGA (tumor versus normal tissue) and plasma (tumor samples versus healthy controls) data on colon, rectal and colorectal cancer. The diagrams present the overlapping TCGA and plasma miRNA signatures in the case of upregulated (A) and downregulated transcripts (B) for the case of colon cancer, similarly for the case of downregulated (C) and overexpressed miRNAs (D). We also present the overlapping of the downregulated (E) and overexpressed miRNAs (F) transcripts for colon, rectal and colorectal cancer.

