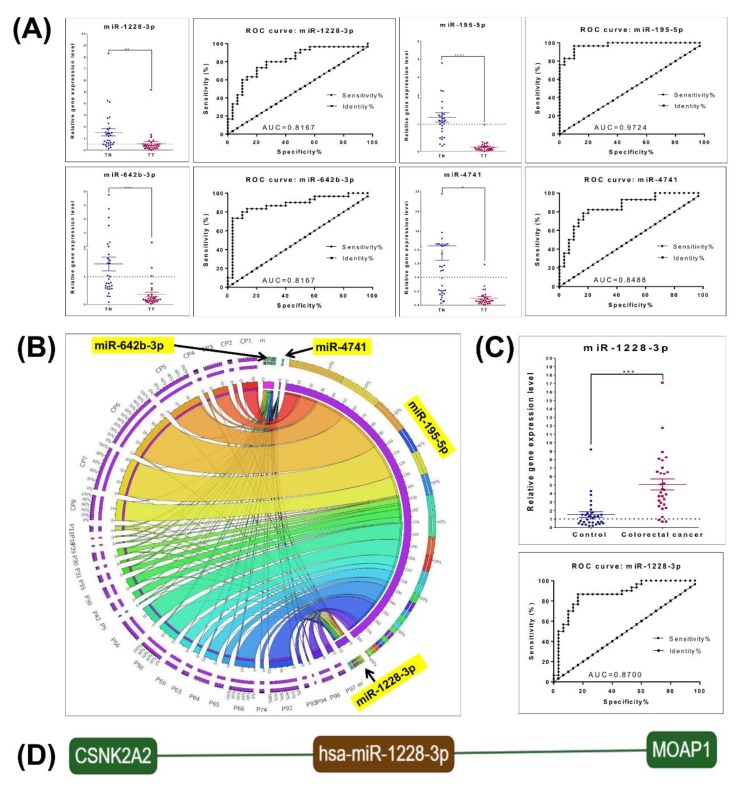
Figure 4.
Tissue and plasma qRT-PCR data validation, the evaluation of the miRNA expression level shows relevant differences. (A) Expression level of miR-1228-3p, miR-642b-3p, miR-195-5p and miR-4741 in tumor tissue and normal tissue, and receiver operating characteristic (ROC) curve; (B) Circos plot of the integrated miRNA spatial signature showing the heterogeneity of the expression level; (C) miR-1228-3p expression level in plasma colorectal patients and healthy controls and ROC curve; (D) miR-1228-3p direct target, generated using miRtargetlink; (* p ≤ 0.05, ** p ≤ 0.01, *** p ≤ 0.001, **** p ≤ 0.0001).

