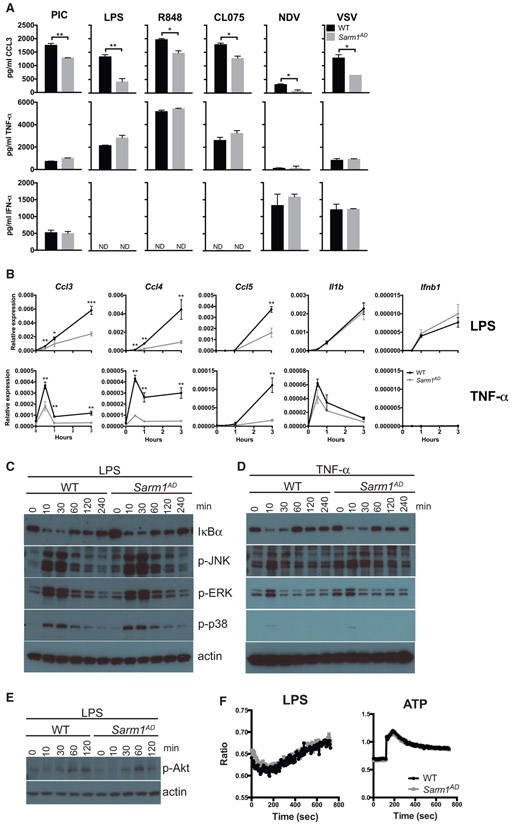
Figure 1. Macrophages from Sarm1AD Mice Have a Defect in the Production of Ccl3, Ccl4, and Ccl5 but Display Normal Signaling Responses.
(A) WT and Sarm1AD macrophages were stimulated with 100 μg/mL of poly(I:C), 5 μg/mL of LPS, 0.01 μg/mL of R848, 10 μg/mL of CL075, or Newcastle disease virus (NDV) or VSV at an MOI of 5 for 24 h. Cytokine production was measured by ELISA.
(B) WT and Sarm1AD macrophages were stimulated with 1 mg/mL of LPS or TNF-α. Cytokine production was measured by qPCR at the indicated time points. Graphs show mean ± SD for triplicate biological replicates and are representative of 3 experiments. *p < 0.05 and **p < 0.01 (unpaired t test).
(C–E) WT and Sarm1−/− macrophages were stimulated with 10 ng/mL of LPS (C and E), or TNF-α (D) for the indicated number of minutes. Signaling responses were measured by western blot.
(F) WT and Sarm1−/− macrophages were stimulated with 100 ng/mL of LPS or 1 mM ATP. Calcium flux was measured by fura-2-acetoxymethyl ester (fura-2 AM) fluorescence. Data are representative of 3 experiments.

