
Figure 3. SARM1 Knockdown and Overexpression Do Not Modulate Chemokine Production.
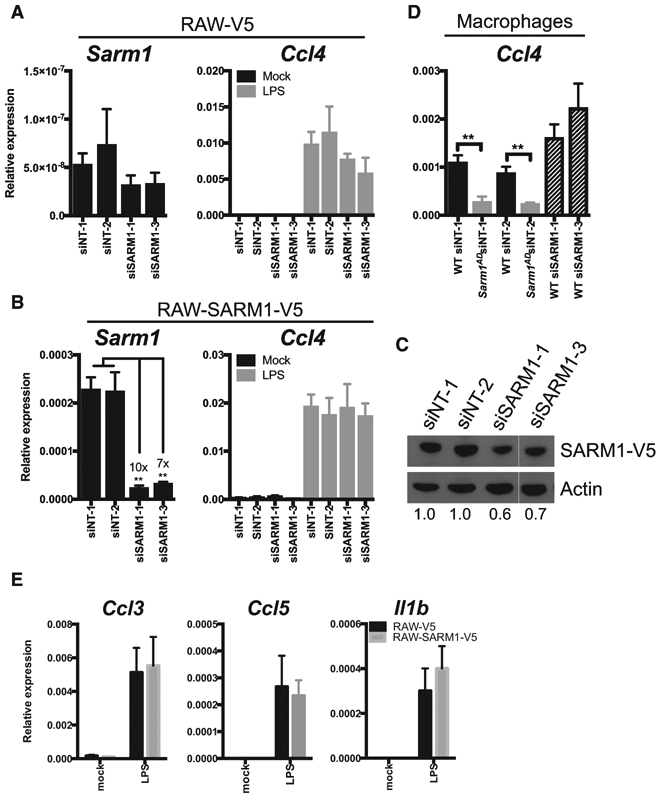
(A) RAW-V5 cells were treated with Sarm1 siRNAs. Sarm1 knockdown efficiency was measured by qPCR (left), or Ccl4 expression was measured after treatment with 10 ng/mL of LPS for 3 h (right).
(B) RAW-SARM1-V5 cells treated as in (A).
(C) Western blot of SARM1 expression in RAW-SARM1-V5 cells treated with Sarm1 siRNAs.
(D) Ccl4 expression by qPCR after treatment with 10 ng/mL of LPS for 3 h in WT and Sarm1AD macrophages after Sarm1 siRNA knockdown.
(E) RAW-V5 and RAW-SARM1-V5 cells were treated with 10 ng/mL of LPS. Cytokine production was measured at 3 h by qPCR.
Graphs show mean ± SD of triplicate biological samples and are representative of 3 experiments. **p < 0.01 (unpaired t test). See full gel image in Figure S1.