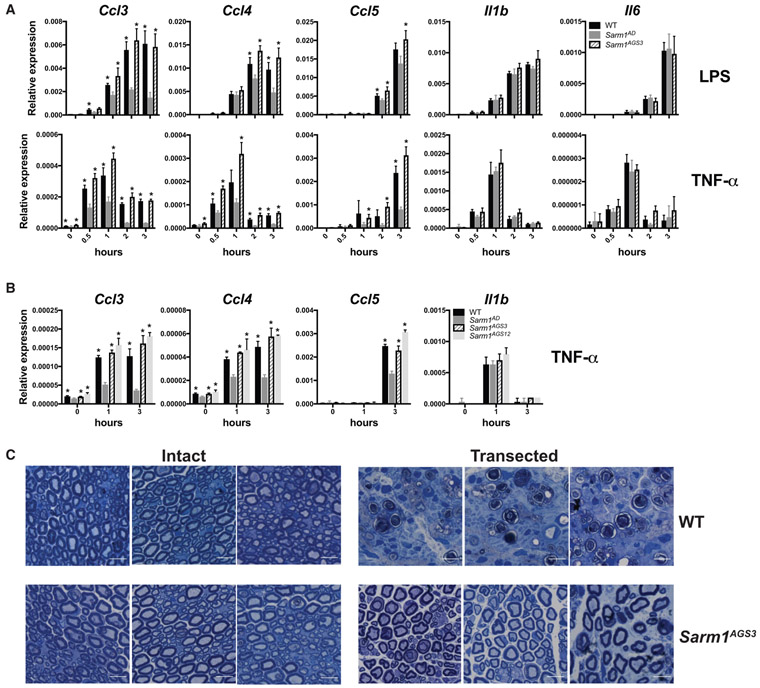
Figure 4. Sarm1 CRISPR Knockout Mice on a Pure B6 Background Show Normal Chemokine Production but Are Protected from Axonal Degeneration.
(A) WT, Sarm1AD, and Sarm1AGS3 macrophages were stimulated with 10 ng/mL of LPS or TNF-α. Cytokine production was measured at the indicated time points by qPCR.
(B) WT, Sarm1AD, Sarm1AGS3, and Sarm1AGS12 macrophages were stimulated with 10 ng/mL of TNF-α as in (A).
(C) Toluidine blue staining of sciatic nerves from untransected (left) and transected (right) WT and Sarm1AGS3 mice 14 days post-transection. Scale bar, 10 μm. Graphs show mean ± SD of triplicate biological samples and are representative of 3 experiments. *p < 0.05 (unpaired t test) is significant for the indicated bar compared with Sarm1AD at the same time point. See also Figure S2 and Table S1.

