
Figure 5. Viral Phenotypes of Sarm1 CRISPR Knockout Mice.
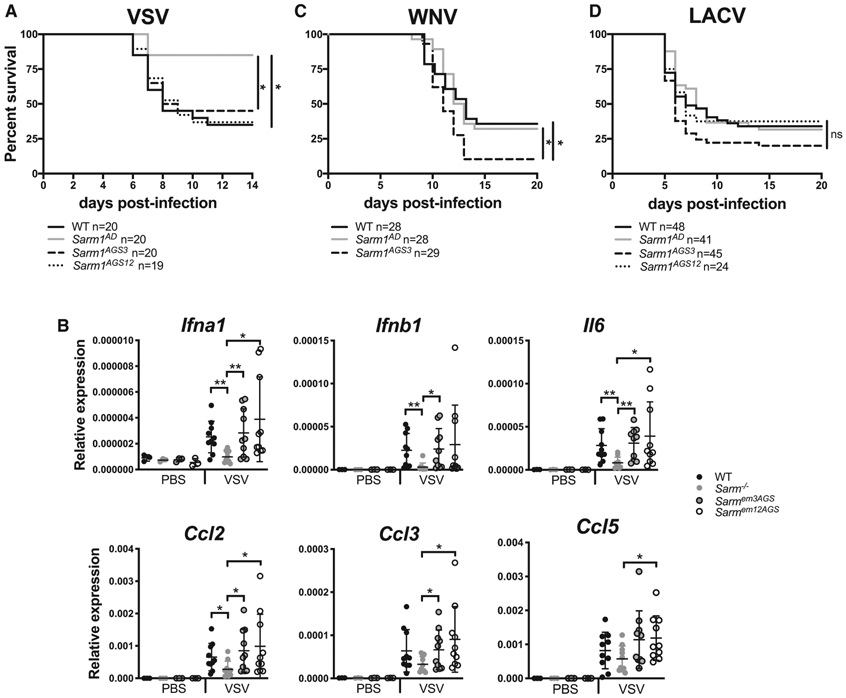
(A) WT, Sarm1AD, Sarm1AGS3, and Sarm1AGS12 mice were infected intranasally with 107 plaque-forming units (PFUs) of VSV, and survival was measured.
(B) Mice were infected as in (C). Chemokine production in the brain was measured by qPCR at day 6 post-infection.
(C) WT, Sarm1AD, and Sarm1AGS3 mice were infected with 102 ffu of WNV-NY99 via footpad injection, and survival was measured.
(D) WT, Sarm1AD, Sarm1AGS3, and Sarm1AGS12 mice were infected intraperitoneally with 103 PFUs of the original LACV strain, and survival was measured.
(A), (C), and (D) show combined results of 2 experiments with similar results; (B) shows mean ± SD for n = 3 (PBS) and n = 10 (VSV) and is representative of 3 experiments. *p < 0.05, log rank test (A, C, and D) and unpaired t test (B). See also Table S2.