Figure 7.
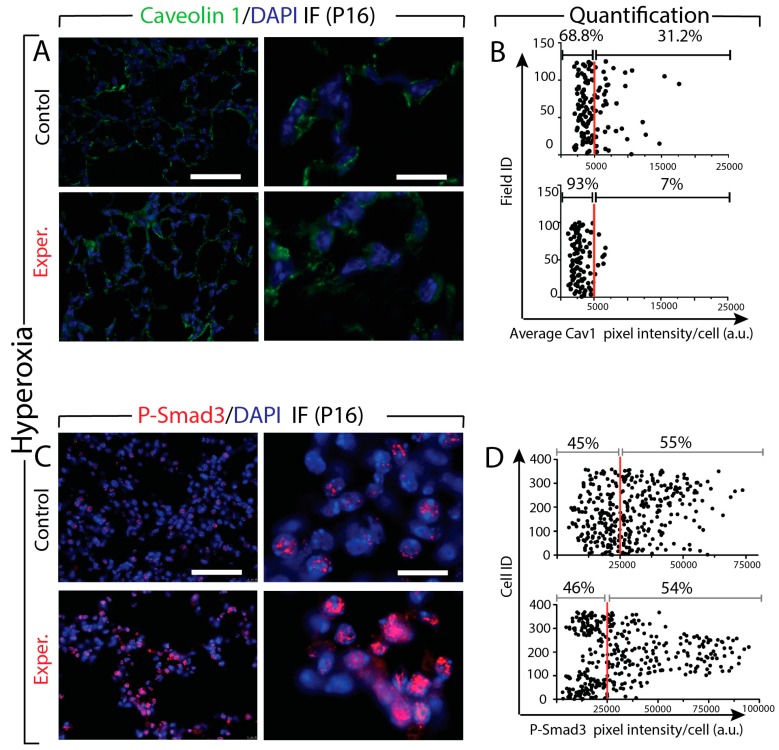
Effect of hyperoxia on the expression of Cav1 and P-Smad3 protein in the lung tissues from control and experimental mice. A. IF images show decrease of Caveolin1 expression. B. Quantification of pixel intensity of Cav1 positive cells indicates a significant decrease of Cav1 expression in the experimental mice. C. The IF images show an increased expression of P-Smad3 in the experimental lungs. D. The quantification of pixel intensity of P-Smad3 positive cells show the same percentile of cells between experimental versus control lungs. Scale bar in A and C: low magnification: 45 μm; high magnification: 180 μm.

