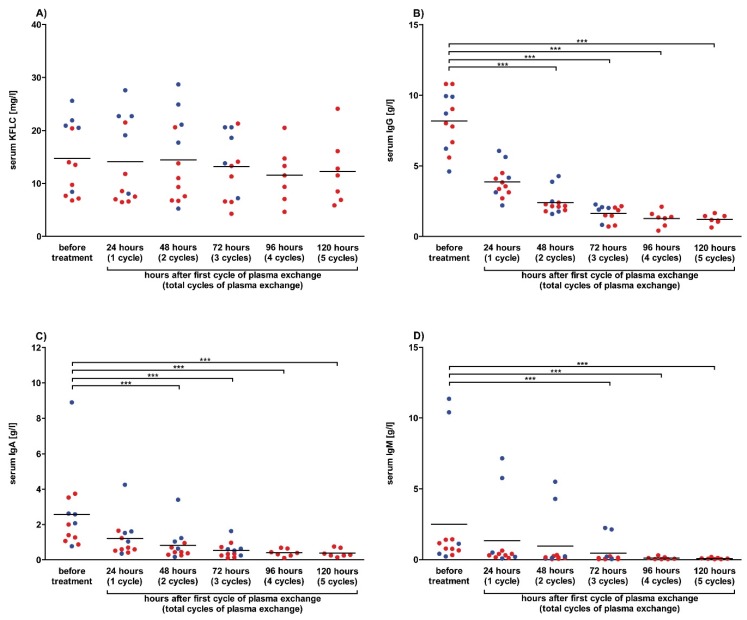
Figure 4.
Serum concentrations after plasma exchange in prospective patients. Serum concentrations of patients whose data and samples were collected in 2018 and 2019 are shown. Depicted are serum concentrations of kappa free light chains (KFLC) (A), immunoglobulin type G (IgG) (B), IgA (C), and IgM (D). Patients treated with 3 cycles of plasma exchange therapy are depicted as blue dots (n = 5), while patients with 5 cycles of treatment are depicted as red dots (n = 7). Blood samples were taken before and after 24, 48, 72, 96, and 120 h of treatment with one cycle of plasma exchange per day. p-values of significant differences are illustrated as asterisks.

