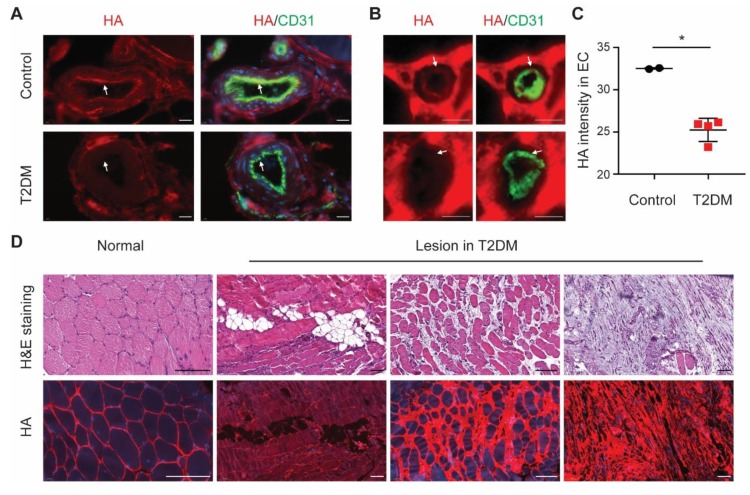
Figure 5.
EC hyaluronan decreases in diabetic ischemic muscle. (A) Representative images of arteries (scale bar = 20 µm) and (B) small capillaries (scale bar = 5 µm) in ischemic muscle of type 2 diabetic patients with critical limb ischemia (n = 4) and control (n = 2), stained with the HA binding probe Ncan-dsRed (red) and CD31 (green) for endothelial localization. (C) Quantification of HA intensity colocalized with CD31 in ECs. (D) Representative images of H&E staining (top row) and HA staining (bottom row) in the normal and lesion area of ischemic muscle of type 2 diabetic foot patients (n = 4, scale bar = 100 µm). Values are given as mean ± SD. * p < 0.05.

