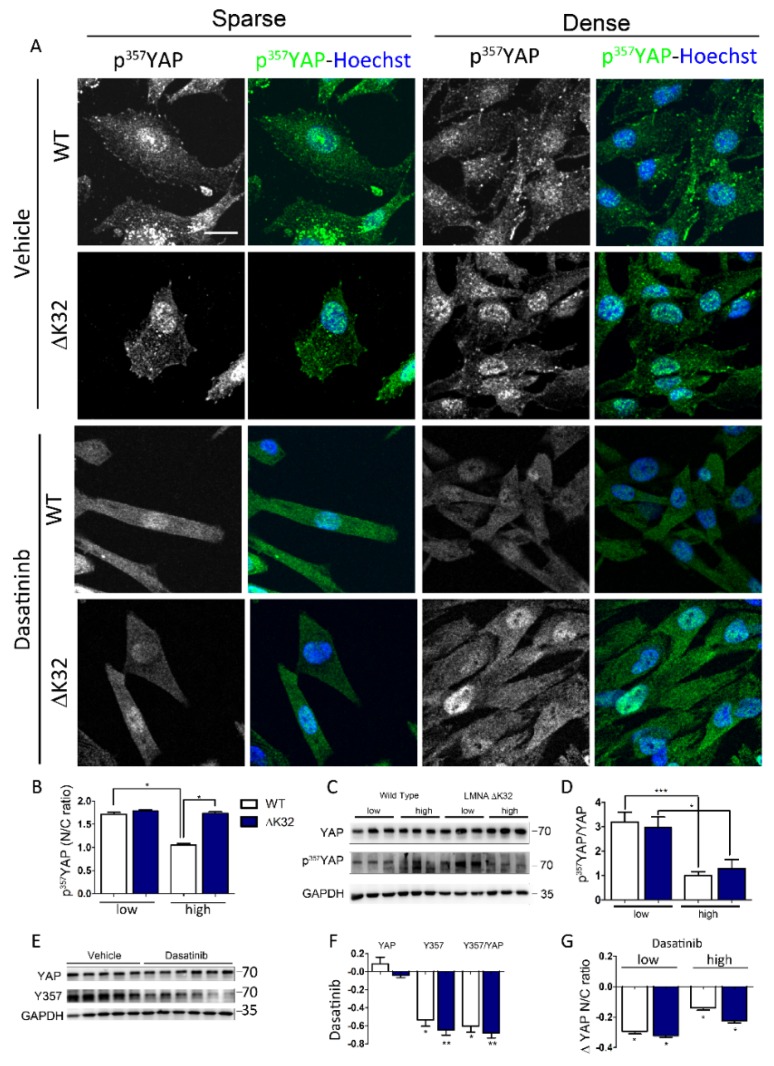
Figure 3.
Y357 phosphorylation of YAP in WT and LMNA mutated MuSCs. (A) Confocal images of pY357-YAP (green) in WT and LMNAΔK32 mutant MuSCs cultured in low and high density conditions, at baseline and after treatment with Dasatinib. Nuclei are stained with Hoechst (blue). Scale bar: 20 µm. (B) Quantification of pY357-YAP nucleo-cytoplasmic (N/C) ratio. Values are expressed as mean ± SEM, n = 150 cells for each cell line. (C) Representative Western-blot of YAP, pY357-YAP, and GAPDH in WT and LMNAΔK32 MuSCs plated at low and high cell density. (D) Quantification of pY357-YAP/YAP protein levels in low and high density conditions, expressed in arbitrary units (a.u.). GAPDH was used as a loading control. Pooled values of WT (WT1 and WT2) are presented. Values are mean ± SEM, n ≥ 4 per conditions. * p < 0.005, ** p < 0.01, *** p < 0.001 compared with WT. (E) Representative Western-blot of YAP, pY357-YAP, and GAPDH in WT and LMNAΔK32 MuSCs treated with vehicle or Dasatinib. (F) Quantification of YAP, pY357-YAP, and pY357-YAP /YAP protein levels after treatment with Dasatinib. Values are expressed as percent change of values obtained without treatment. GAPDH was used as a loading control. Pooled values of WT (WT1 and WT2) are presented. Values are mean ± SEM, n ≥ 4 per conditions. * p < 0.005, ** p < 0.01, compared with WT. (G) Quantification of pY357-YAP nucleo-cytoplasmic (N/C) ratio after Dasatinib treatment expressed as a fraction of control value obtained in sparse or dense conditions before treatment. Values are expressed as mean ± SEM, n ≥ 110 cells for each cell line.

