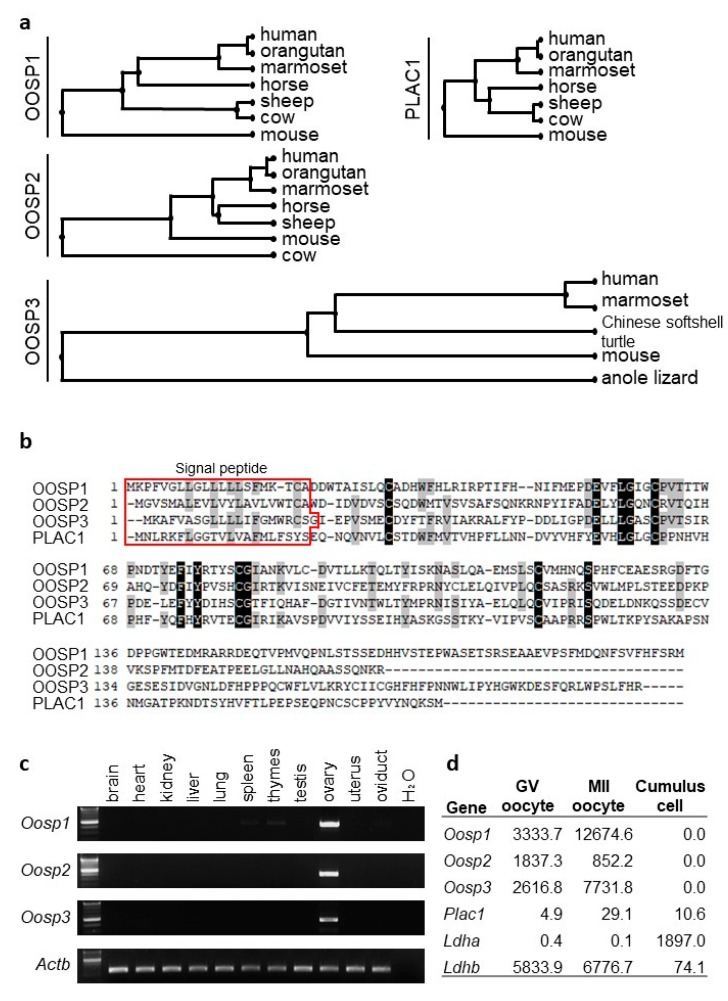
Figure 1.
Conservation of Oosp family genes between species and tissue expression analysis. (a) Phylogenetic trees. (b) Amino acid homology between OOSP family. All four genes have a signal peptide sequence as coded by amino acids 1-21. (c) RT-PCR analysis using multiple tissues. Actin beta (Actb) was used as the control. (d) Expression levels in germinal vesicle (GV) oocytes, metaphase II (MII) oocytes, and cumulus cells. Ldha and Ldhb are shown as the control. FPKM: fragments per kilobase of exon per million reads mapped.

