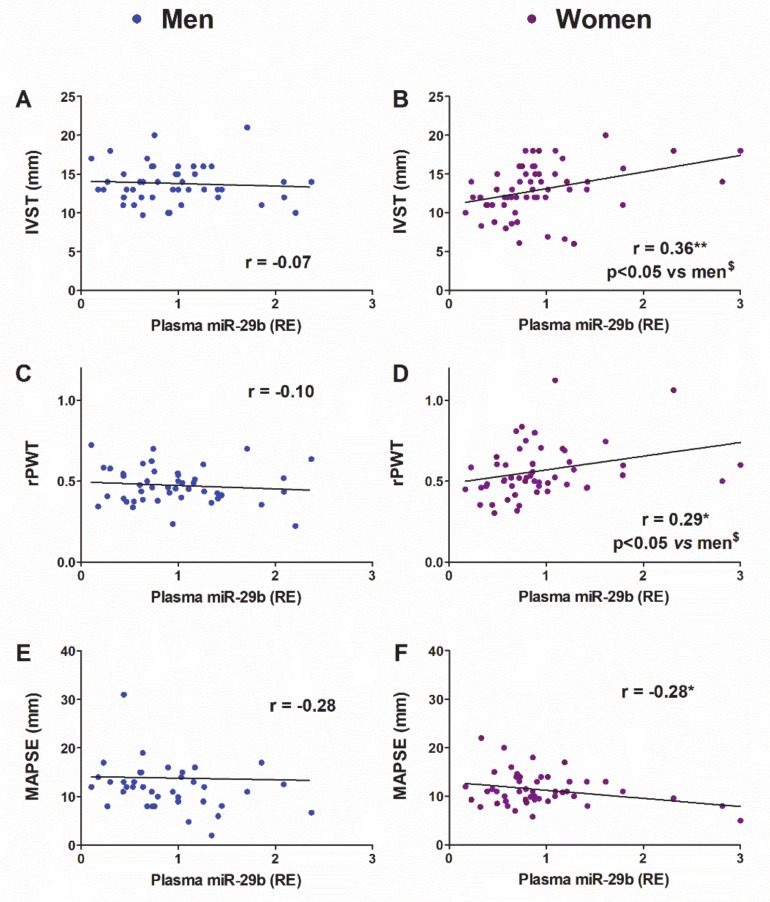
Figure 8.
Linear regression and Pearson’s correlation analyses showing the relationship between plasma miR-29b expression and morpho-functional parameters in patients older than 50 years. IVST, interventricular septum thickness in men (A) and women (B); rPWT, relative posterior wall thickness in men (C) and women (D); MAPSE, mitral annular plane systolic excursion in men (E) and women (F). r, Pearson’s correlation coefficient. * p < 0.05, ** p < 0.01. $Comparative analysis of women vs. men correlations with cocor.

