Figure 2.
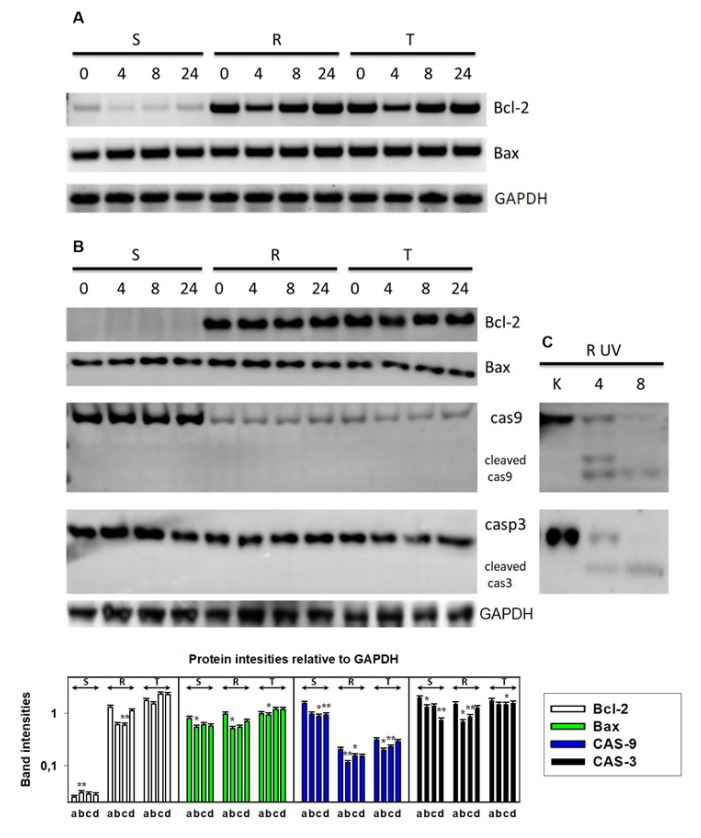
Expression of proteins that are active in apoptosis (Bcl2, Bax, and caspases 3 and 9 and their proteolytically activated forms) in S, R, and T cells after incubation in medium containing 0.1 µM tunicamycin for 0, 4, 8, and 24 h: (A) Detection of Bcl2 and Bax transcripts using RT-PCR and detection in agarose gel. (B) Western blot detection of Bcl2, Bax, and caspases 3 and 9: GAPDH was used as an internal control. Densitometry quantification of protein bands from Western blots (column plot expressed as the mean ± S.E.M. of three independent measurements of data relative to the GAPDH signal). Cells were incubated in the presence of 0.1 μM tunicamycin for 0 (a), 4 (b), 8 (c), and 24 (d). Significance: Data differ from values obtained in cells that were not incubated in the presence of tunicamycin (a) at the levels: * p < 0.02; ** p < 0.002. (C) Activated, proteolytically cleaved caspase 9 (upper) and caspase 3 (lower) as a control for caspase activation in R cells after 10 min of UV irradiation using a germicide lamp: After irradiation, the cells were incubated for 4 and 8 h in culture medium. Similar proteolytically cleaved forms of caspases after UV irradiation were also detected in S and T cells (not shown).

