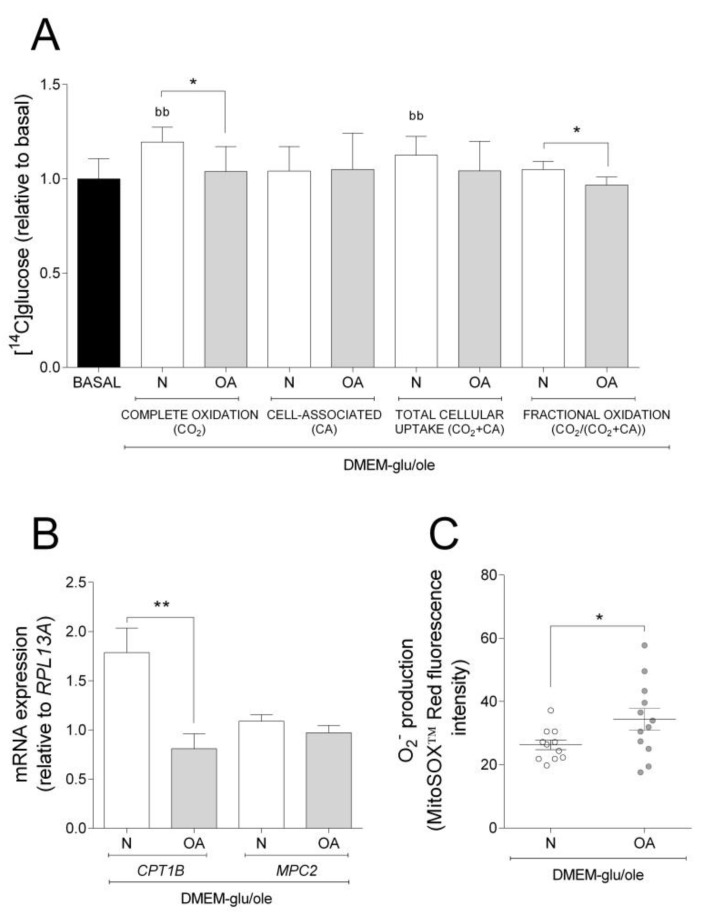
Figure 2.
Effect of oleic acid on glucose metabolism, mRNA expression, and O2− production. Effect of culturing cells in DMEM-glu/ole (i.e., DMEM 5.5 mM glucose supplemented with 100 µM oleic acid) compared to DMEM-glu (basal, i.e., DMEM 5.5 mM glucose). (A) Glucose metabolism. (B) mRNA expressions of carnitine palmitoyltransferase 1B (CPT1B) and mitochondrial pyruvate carrier 2 (MPC2) normalized to the expression of RPL13A. (C) Anion superoxide production (O2−). N and OA data included the values for haplogroups H and J combined. All data were obtained from three independent experiments, each with four replicates and two clones per donor. Values are presented as mean ± SEM relative to basal. * Statistically significant difference between N and OA cybrids (* p ≤ 0.05, ** p ≤ 0.01, unpaired t-test). b Statistically significant versus basal (bb p ≤0.01, paired t-test). N, healthy cybrids; OA, osteoarthritis cybrids.

