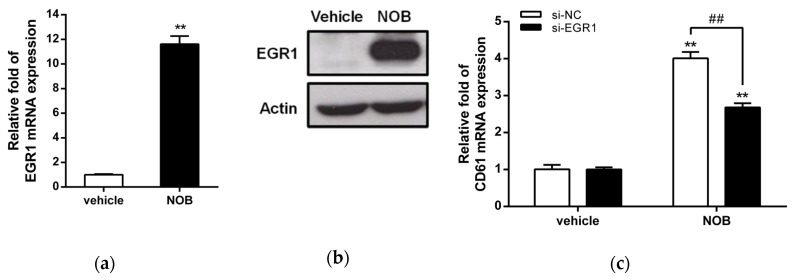
Figure 6.
Effects of NOB on the expression of cell differentiation-related genes in K562 cells. Cells were treated with vehicle or NOB (80 μM) for 48 h. (a) The EGR1 mRNA levels were determined by Q-RT-PCR analysis. (b) The EGR1 and actin protein levels were measured by Western blot analysis. The experiments were performed at three times, and a representative blot is shown. (c) K562 cells were transfected with the small interference RNA (siRNA) negative control (si-NC) or si-EGR1 to knock down EGR1. The si-NC- or si-EGR1-transfected cells were treated with vehicle or NOB (80 μM) for 48 h. The level of CD61 mRNA was determined by Q-RT-PCR. The data represent the mean ± SD of three independent experiments. **p < 0.01 represents significant differences compared with the vehicle-treated cells. ##p < 0.01 represents significant differences compared with the si-NC-transfected group.

