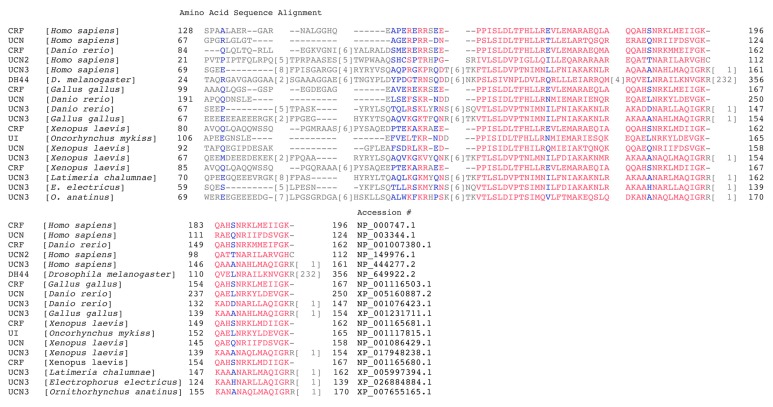
Figure 3.
A comparison of examples of primary amino acid sequence from each group of CRF and urocortin precursor peptides found in the Protein data bank and generated using the multiple alignment tool from NCBI Blast. Red and blue are alignment columns with no gaps, whereas grey residues are with gaps. Highly conserved amino acids are shown in red and less conserved amino acids are shown in blue based on the residues’ relative entropy thresholds.

