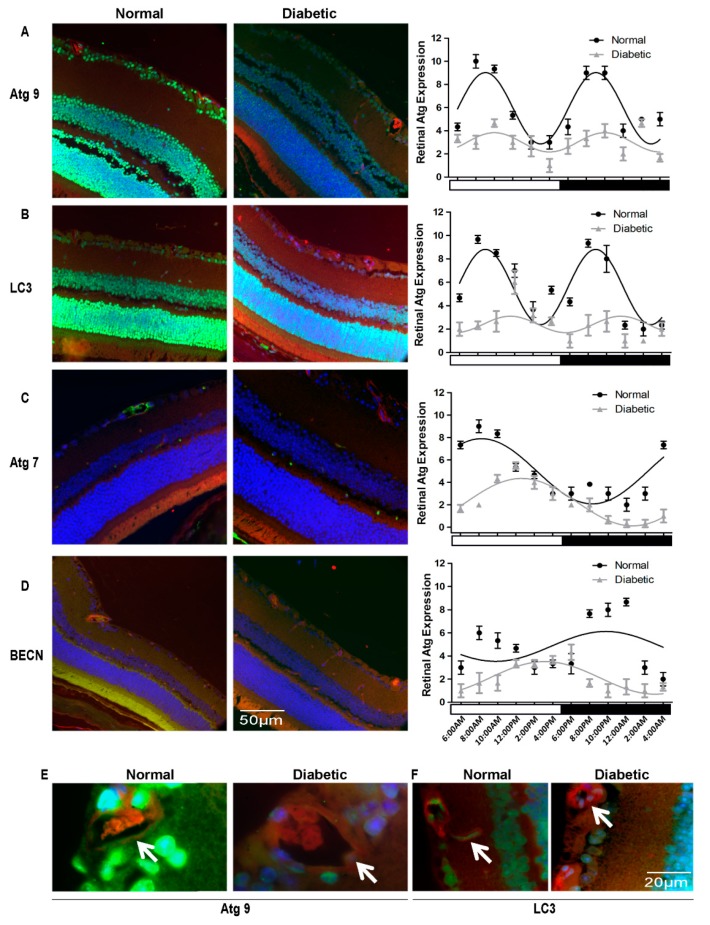
Figure 7.
Impairment of diurnal rhythmicity of autophagy in T2D rats. Eyes were collected from 6.5-month old BBZDR/wor type 2 diabetic rats with 4-month duration of diabetes and the normal age-matched rats selected as controls. Immunostaining demonstrated a dramatic decrease in amplitude of diurnal rhythmicity of autophagic protein expression in the retina of the diabetic animals compared to normal rats. Representative micrographs of immunostained sections at 8:15 am are shown for (A) ATG9, (B) LC3 (C) ATG7 (D) Beclin1 (BECN). Autophagy protein expression is green, TRITC agglutinin for vessels red and DAPI nuclear staining blue. The arrows indicate autophagy protein localization to retinal vessels. RGC, retina ganglion cell; INL, inner nuclear layer; OPL, outer plexiform layer; ONL, outer nuclear layer; RPE, retinal pigment epithelium. ATG7 and Beclin1 displayed phase-shifting in the diurnal oscillation (C) and (D) respectively. Loss and phase-shifting of diurnal rhythmicity in diabetic retinopathy is demonstrated in single cosine plot with ordinary least square fitted (p < 0.01, n = 10). High magnification images confirmed the loss of autophagy proteins ATG9 and LC3 in the retinal vasculature (E). All animals were maintained in a standard 12/12-h light/dark phase with lights ON at 6:00 AM and lights OFF at 6:00 PM. The error bars in the circadian plots represent the mean + SEM and diurnal oscillation had a p-value less than 0.05.

