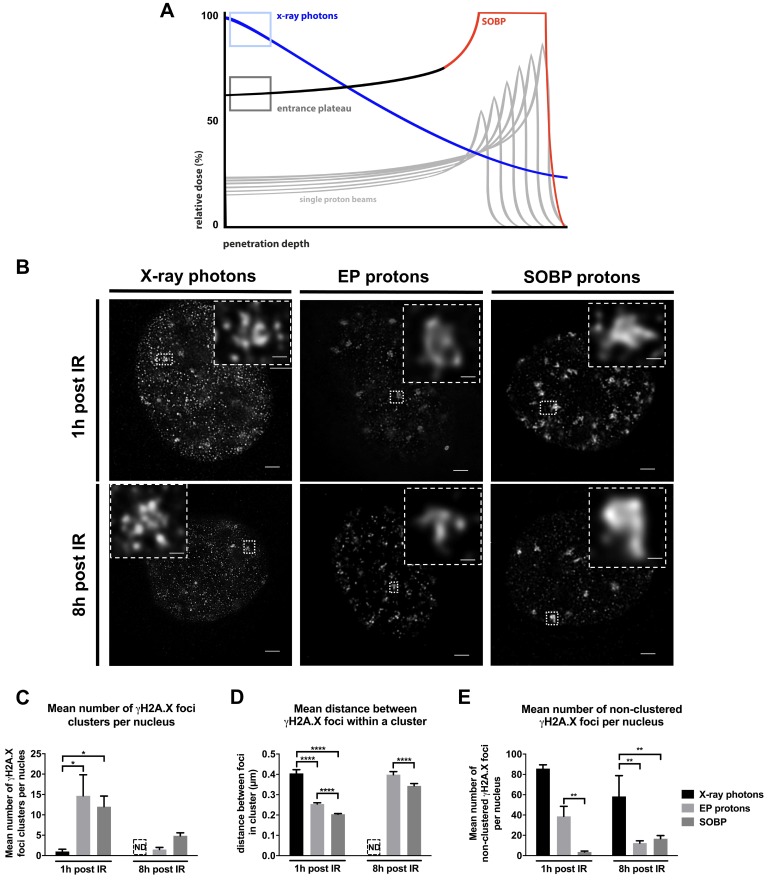
Figure 1.
Time-dependent induction and removal of γH2A.X foci in MEFs irradiated with a physical dose of 3 Gy of X-ray photons, EP and SOBP protons visualized by γH2A.X staining. (A) Model of irradiation setup. Depth-dose curves of an X-ray photon beam and a proton beam highlighting the depth area where the cells were irradiated with X-ray photons, Bragg-peak protons and plateau protons. (B) STED microscopy pictures of a single nucleus of MEFs after 1 h and 8 h of 3 Gy irradiation with X-ray photons, EP protons or SOBP protons (objective 100×); scale bar: 0.1 µm. Clustered γH2A.X foci were additionally zoomed in 40× (small squares in the edge). Scale bar: 0.1 µm. (C–E) Quantification of γH2A.X foci in MEFs irradiated with 3 Gy of X-ray photons, EP and SOBP protons. (C) Average number of clusters per nucleus. (D) Average distance between γH2A.X foci in clusters. (E) Average number of foci per nucleus beyond clusters. Data represent mean ± SEM; One-way ANOVA with Tukey’s multiple comparisons post-test and Kruskal–Wallis test; * p < 0.05; ** p < 0.01; **** p < 0.0001; ND – not detectable.

