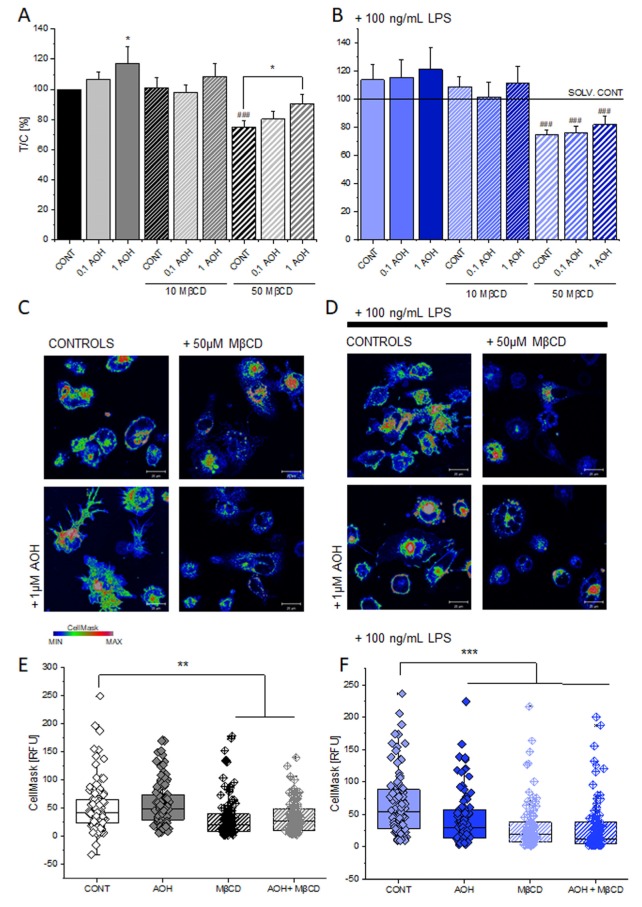
Figure 2.
Effect of AOH (0.1–1 μM) and MβCD (10–50 μM) on the membrane fluidity of THP-1 macrophages at indicated conditions (A) and in additional presence of 100 ng/mL LPS (B). Data are mean ± SEM of eight independent experiments performed in triplicate. ### (p < 0.001) identifies significant decrease, according to the ANOVA test with Fisher test in comparison to controls. The appearance of the membrane of THP-1 macrophages (C,D) after 1 h incubation with the compounds of interest and staining with CellMask for cell membrane. Scale bar: 20 µm. Quantification of fluorescence intensity of the cell membrane staining (RFU, Relative Fluorescence Units; 1 μM AOH, 50 μM MβCD or 1 μM AOH + 50 μM MβCD; (E,F)). Data are obtained from the quantification of n ≥ 80 cells from four independent experiments and ** and *** indicate significant difference in comparison to controls with p < 0.01 and p < 0.001 with Student’s t-test.

