Figure 3.
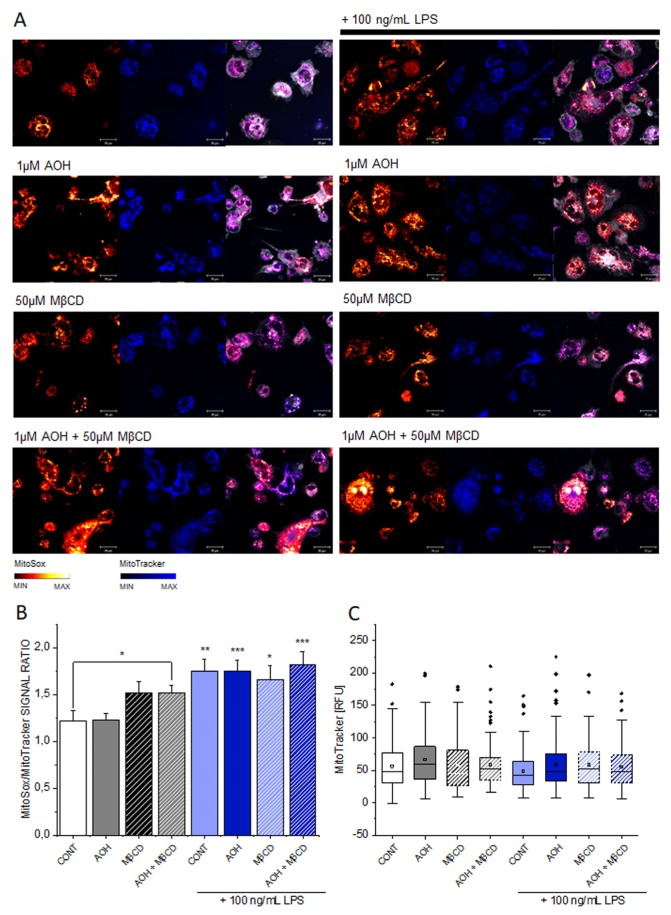
Mitochondrial superoxide response in THP-1 macrophages. Signal intensities of MitoSox range from orange to white, of MitoTracker from black to blue (see color bars) and cell membraneintensities are depicted in white (A). MitoSox/MitoTracker signal ratio measured after 1 h incubation (B). Intensity of the mitochondrial signal as reference (C). Incubation refer to 1 μM AOH, 50 μM MβCD or combination of the two in presence or absence of LPS 100 ng/mL. Scale bar, 20 µm. Data are mean ± SEM n ≥ 80 cells from 4 independent experiments. * (p < 0.05), ** (p < 0.01), *** (p < 0.001) significant difference according to Student’s t-test in comparison to controls.

