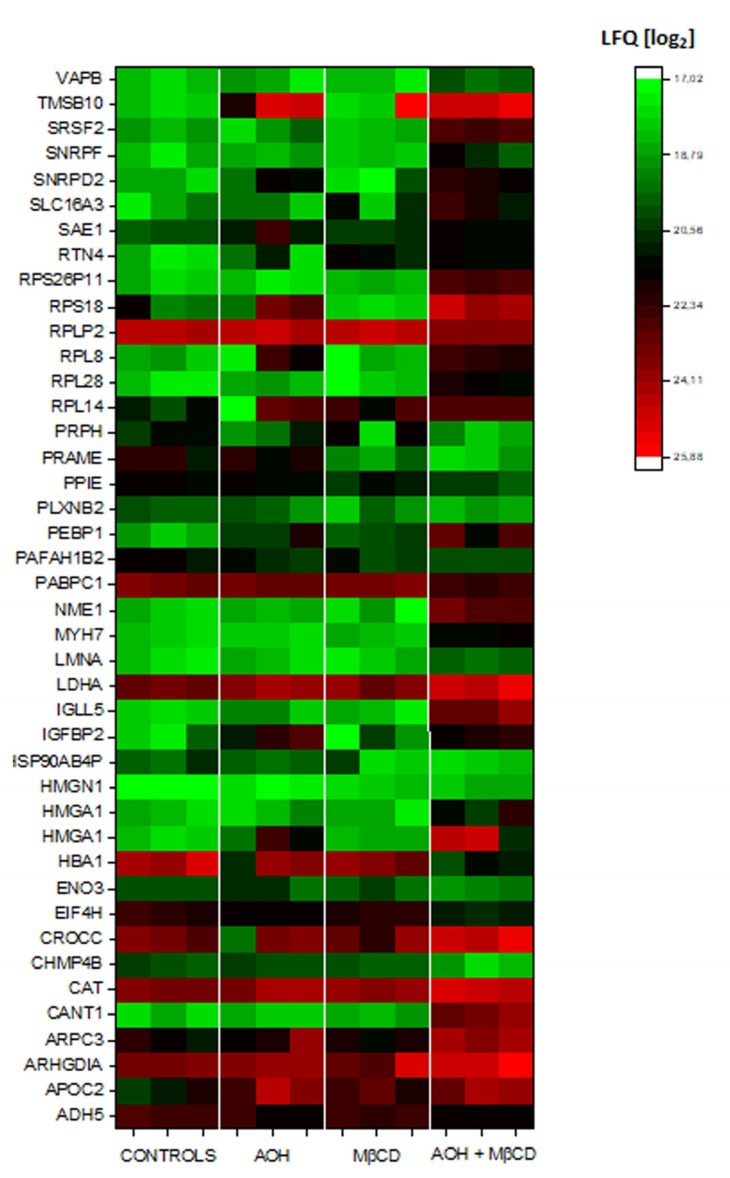
Figure 4.
Secretome analysis of THP-1 macrophages incubated with AOH (1 μM) and/or MβCD (50 μM) for 5 h. Heat map depict the 3 biological replicates performed for each treatment group and includes all the proteins significantly regulated by the combination of 1 μM AOH + 50 μM MβCD. Single treatment (1 μM AOH or 50 μM MβCD alone) induced no significant regulation in comparison to controls. Green to Red colors depict the variation of the LFQ intensities [log2].

