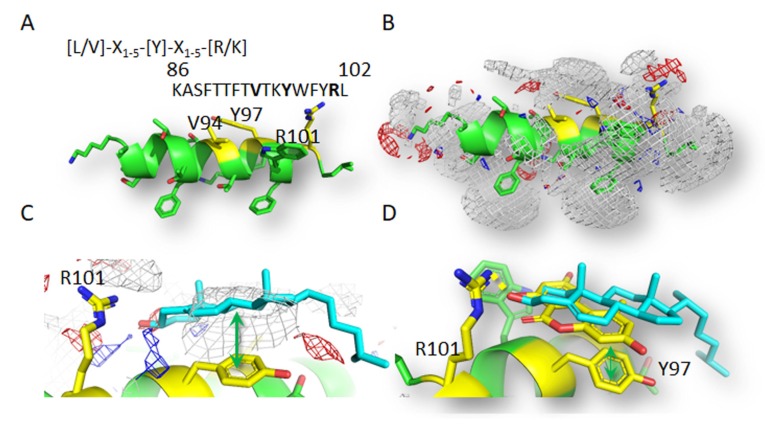
Figure 5.
CRAC motif and the modeled CRAC portion of caveolin 1’s CSD domain. (A) CSD sequence containing the CRAC motif is shown and the conserved residues are highlighted in bold. (B) The protein is represented in sticks and cartoon, while gray, red and blue meshes indicate regions sterically and energetically able to receive hydrophobic, H-donor acceptor and H-bond donor groups, respectively. (C) Calculated interaction of cholesterol (represented in cyan sticks) at the CRAC portion of caveolin 1’s CSD domain. The protein is represented in sticks and cartoon, while gray, red and blue meshes indicate regions sterically and energetically able to receive hydrophobic, H-donor acceptor and H-bond donor groups, respectively. The green arrow indicates the formation of hydrophobic stacking, while the yellow dotted line indicates the formation of polar interaction. (D) Calculated interaction of AOH (represented in yellow sticks) overlapped to the calculated pose of cholesterol (represented in cyan sticks) at the CRAC portion of caveolin 1’s CSD domain. The green arrow indicates the formation of hydrophobic stacking, while the yellow dotted line indicates the formation of polar interactions.

