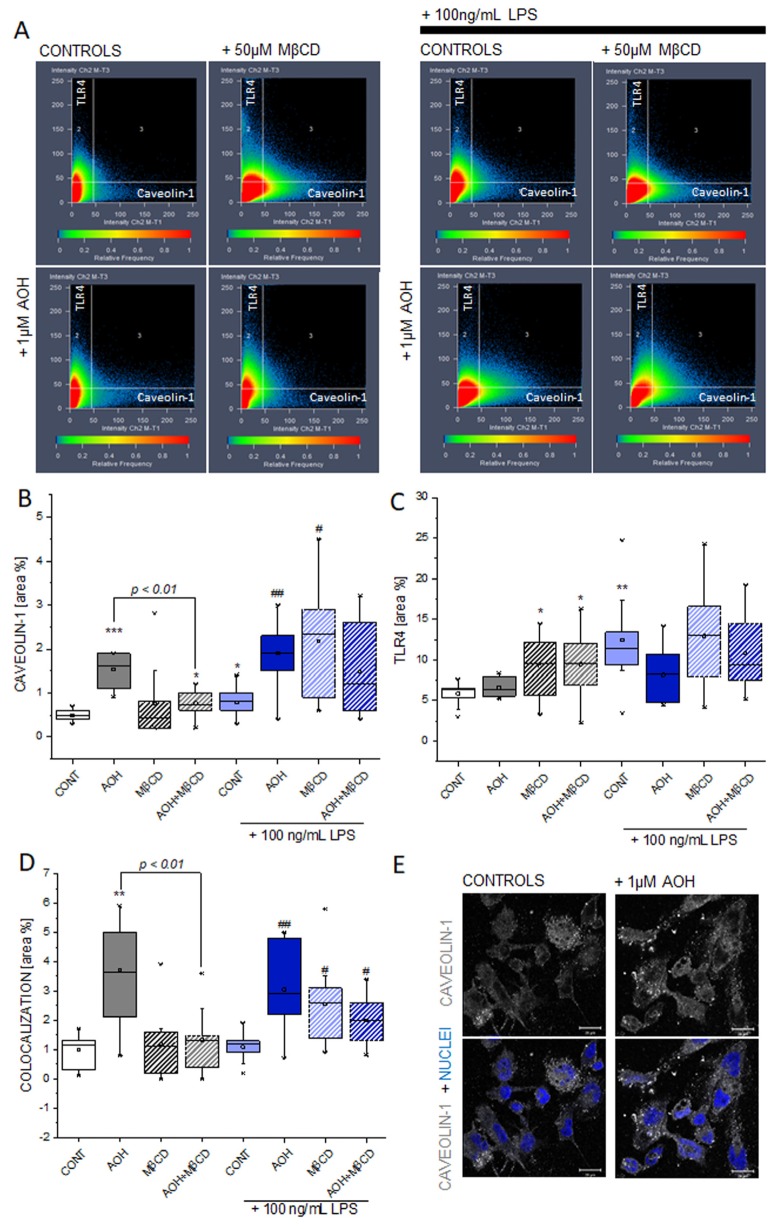
Figure 6.
Influence of AOH on the immunolocalization of caveolin-1 and TLR4. Signal intensity and co-localization of the fluorescent signals (A). Area of caveolin-1 signal (B), TLR4 (C) and co-localization (D), after 1 h incubation with 1 μM AOH, 50 μM MβCD, or both in presence or absence of 100 ng/mL LPS. Appearance of the immunolocalization of caveolin-1 in THP-1 macrophages in control conditions and after 1 h incubation with 1 μM AOH (E). Scale bar, 20 µm. Data are mean of n ≥ 8–9 optical fields obtained from three independent experiments, * (p < 0.05), ** (p < 0.01), *** (p < 0.001) and # (p < 0.05), ## (p < 0.01) indicate significant differences in comparison to controls (CONT) and CONT + LPS, respectively (Mann–Whitney test).

