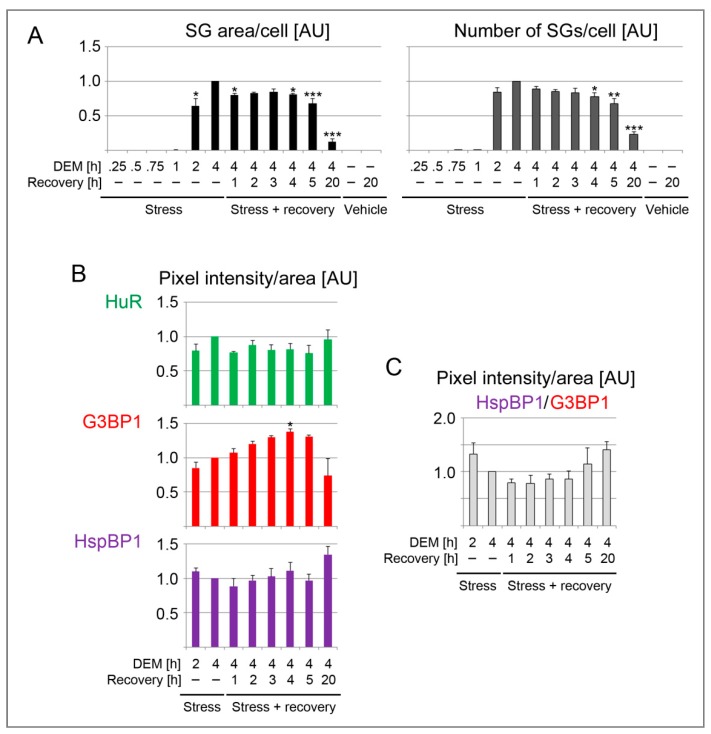
Figure 4.
Quantification of SG parameters in DEM-treated HeLa cells. Each dataset was normalized to the 4-hour DEM treatment. (A) HeLa cells were incubated with growth medium containing 2 mM DEM or vehicle for the times indicated. After the 4-hour treatment, cells were transferred to growth medium for recovery. The results are shown as average +SEM for 3 to 4 independent experiments. For each experiment, at least 44 cells were analyzed for every data point. G3BP1 and HuR served as SG markers. One-Way ANOVA with Bonferroni correction was performed for 2-hour DEM, 4-hour DEM and all stress recovery points. The results for 4-hour DEM were used as reference. * p < 0.05, ** p < 0.01, *** p < 0.001. (B) The SG association of HuR, G3BP1 and HspBP1 was measured for individual SGs. Different time points were assessed during stress and recovery. The pixel intensity/SG area was quantified for 3 to 4 independent experiments. Each dataset was normalized to the 4-hour DEM treatment. Except for overnight recovery (317 SGs), the total number of SGs examined for each time point was between 1145 and 2059. * p < 0.05. (C) The ratio HspBP1/G3BP1 was calculated for the pixel intensity/area. Individual datasets were normalized to the results for 4-hour DEM incubation. AU, arbitrary units.

