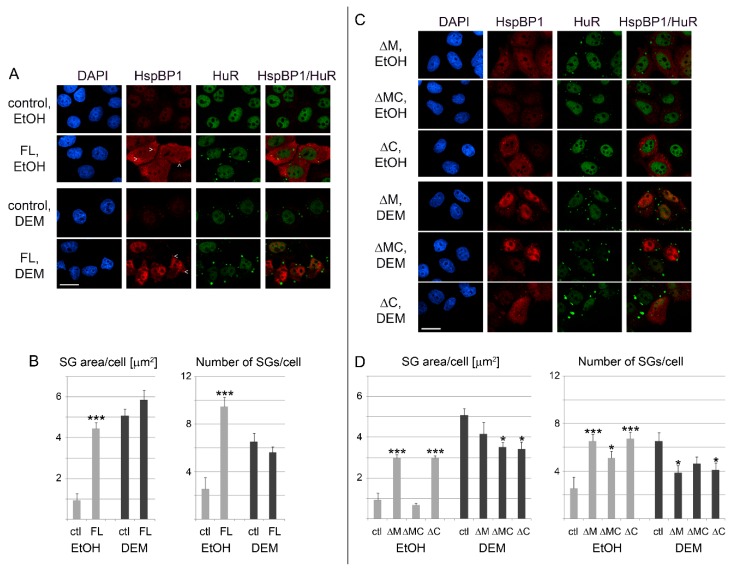
Figure 8.
(A) HspBP1 overexpression induces the formation of SGs. HeLa cells were transiently transfected with plasmids encoding full length HspBP1 (FL). The SG marker HuR was used to monitor granule formation. All images were acquired with the same settings; signals for HspBP1 are therefore low in control cells. The position of several SGs is marked by arrowheads. Scale bar is 20 μm. (B) The effects of HspBP1 overexpression on SG area and number was quantified for a representative experiment. SG parameters were measured for 20 cells/condition, as described for Figure 6. Student’s t-test identified significant differences between controls and cells overexpressing HSPBP1. Comparisons were made within vehicle (EtOH) or DEM groups; *** p < 0.001. (C,D) Role of hsp70-interacting domains for SG production. The impact of HspBP1 deletion mutants on SG formation was analyzed for vehicle and DEM-treated cells as in part A and B. Statistical evaluation was performed with One-Way ANOVA plus Bonferroni correction, using control cells (ctl) as reference; * p < 0.05; *** p < 0.001. Scale bar is 20 μm.

