Figure 1.
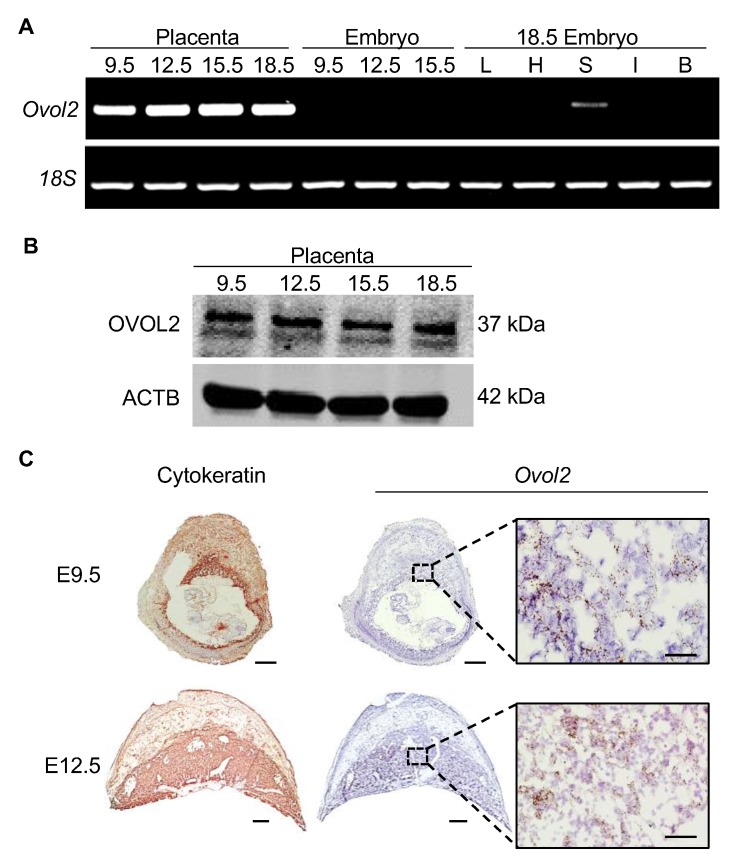
OVOL2 expression in mouse tissue throughout gestation. (A) RT-PCR analysis showing expression of Ovol2 and Rn18s (18S) in mouse placenta and embryo on E9.5, 12.5, 15.5, and 18.5. Ovol2 expression in embryonic liver (L), heart (H), skin (S), intestine (I), and brain (B) were also assessed on E18.5. (B) Western blot analysis showing protein expression of OVOL2 in mouse placenta at E9.5, 12.5, 15.5, and 18.5. ACTB was used as a loading control. (C) In situ hybridization showing Ovol2 transcript localization in mouse placenta at E9.5 and 12.5. Cytokeratin immunohistochemistry was used to delineate the placenta. The dashed boxes in the low magnification images denote the location of the high magnification images. Scale bar = 500 µm for all images except for the high magnification Ovol2 panels, which represent 50 µm.

