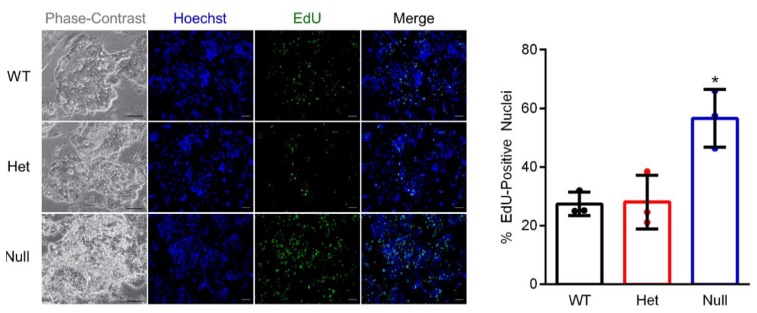
Figure 5.
Ovol2-null TS cells exhibit increased proliferation. Representative phase-contrast images (left panels) of wild-type (WT), Ovol2-heterozygote (Het), and Ovol2-null mouse TS cells. Detection of incorporated EdU (green) was used to assess proliferation of cells. Hoechst was used to detect nuclei (blue). The percent EdU-positive nuclei is shown in the graph on the right. Values significantly different from WT (N = 3, P < 0.05) are indicated with an asterisk (*). Scale bars = 100 µm. Graph represents means (SD).

