Figure 6.
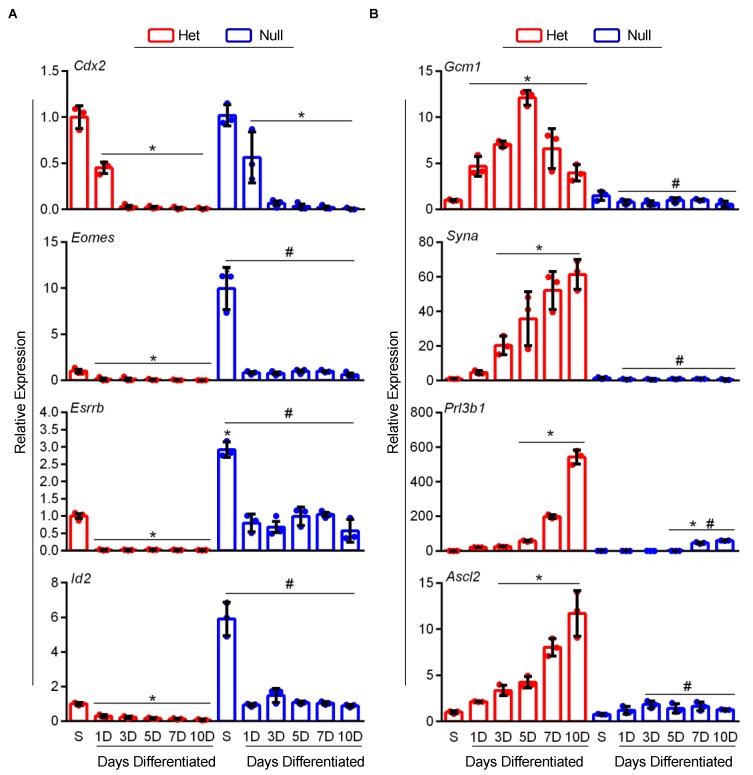
Ovol2-null TS cells express high levels of stem-related genes and exhibit impaired differentiation potential. Quantitative RT-PCR was used to analyze expression of (A) stem (Cdx2, Esrrb, Eomes, and Id2) and (B) differentiation markers (Gcm1, Syna, Prl3b1, and Ascl2) in Ovol2-heterozygote (Het) and null TS cells cultured in stem conditions (S) or up to 10 days in differentiation conditions. Values significantly different from Ovol2-Het TS cells cultured in stem conditions are represented with an asterisk (*, N = 3, P < 0.05); values significantly different between Ovol2-Het and null TS cells at each respective time point are indicated with a number sign (#, P < 0.05). Graphs represent means (SD).

