Figure 7.
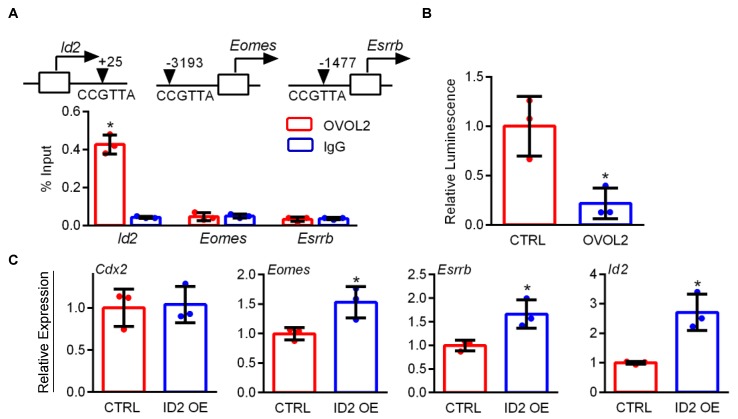
OVOL2 interacts with the Id2 gene. (A) ChIP was performed using OVOL2 or IgG (negative control) antibodies in lysates of mouse TS cells differentiated for 3 days. Quantitative PCR was used to detect enrichment, using primers spanning CCGTTA sequences near transcription start sites of Id2, Eomes, and Esrrb. (B) Relative luciferase activity measured in HEK-293T cells transfected with Id2-Luc and either the CTRL plasmid or pEF-OVOL2-FLAG. (C) Quantitative RT-PCR showing relative expression of Cdx2, Eomes, Esrrb, and Id2 in mouse TS cells transfected with CTRL or pEF-ID2-FLAG (ID2 OE). Values significantly different (N = 3, P < 0.05) from controls are indicated with an asterisk (*). Graphs represent means (SD).

