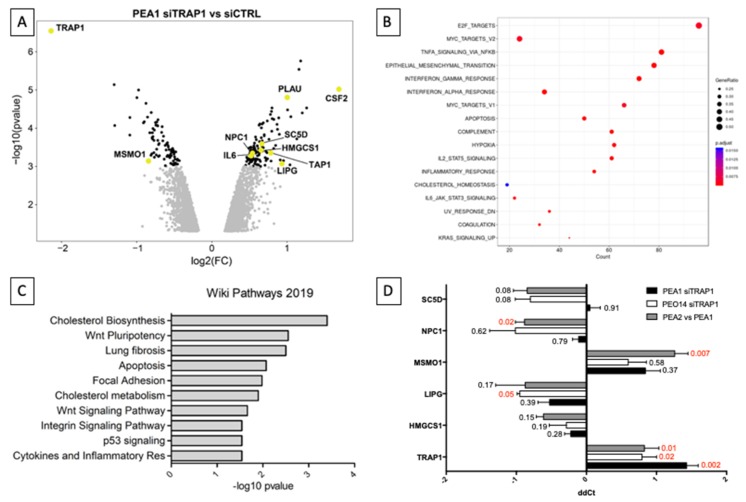
Figure 1.
TRAP1 expression modulates genes involved in inflammation and lipid homeostasis. (A) Volcano plot showing the whole genome gene expression changes in PEA1 cells upon siRNA-mediated TRAP1 silencing (black = p < 0.001, light gray = p< 0.01). Relevant transcripts are highlighted, chosen for belonging to the cholesterol pathway or the inflammatory response. (B) Dot-plot representing hallmarks emerging from gene set enrichment analysis of the differentially expressed genes upon siRNA-mediated TRAP1 silencing in PEA1 cells. (C) Gene set enrichment analysis on the list of genes significantly modulated in expression (p < 0.001) upon TRAP1 silencing in PEA1 cells as for the microarray analysis. (D) Real-time RT-PCR analysis of genes involved in the cholesterol metabolic pathway found differentially expressed upon TRAP1 silencing in PEA1 cells according to microarray analyses. PEA1 and PEO14 cells were transfected with nontargeting control siRNA or TRAP1-directed siRNA (siTRAP1) and collected 72 h after transfection. All data are expressed as mean ± standard error of the mean (S.E.M.) of delta-delta Ct (ddCt) from six (PEA1 siTRAP1), three (PEO14 siTRAP1), or four (PEA2 vs. PEA1) independent experiments with technical triplicates each. Numbers indicate the statistical significance (p-value), based on the Student’s t-test (significant values highlighted in red).

